What is AI being used for? Here's a report on the actual usage of 100 trillion tokens

Based on data for 100 trillion tokens from
State of AI | OpenRouter
https://openrouter.ai/state-of-ai
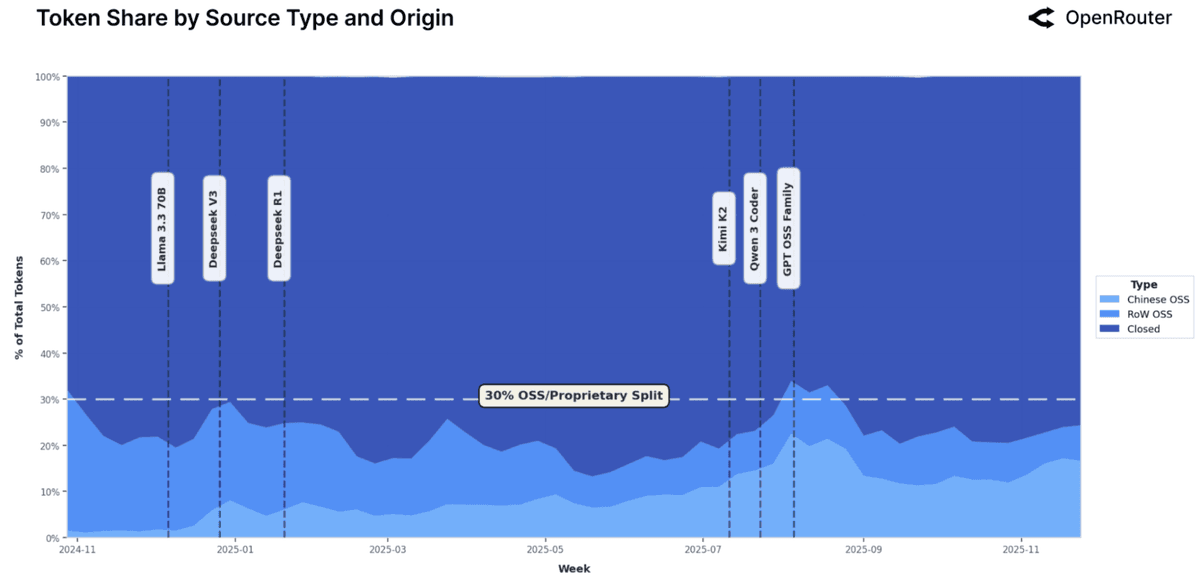
First, below is a chart categorizing tokens from the past year by source. The horizontal axis is time, with the release dates of the major open models shown in the middle. The vertical axis is the percentage of tokens as a whole, with the dark blue representing the majority being closed models. Next are global open models. The light blue at the bottom represents Chinese-made open models. Looking at it this way, we can see that there have been almost no periods when open models accounted for more than 30% in total.
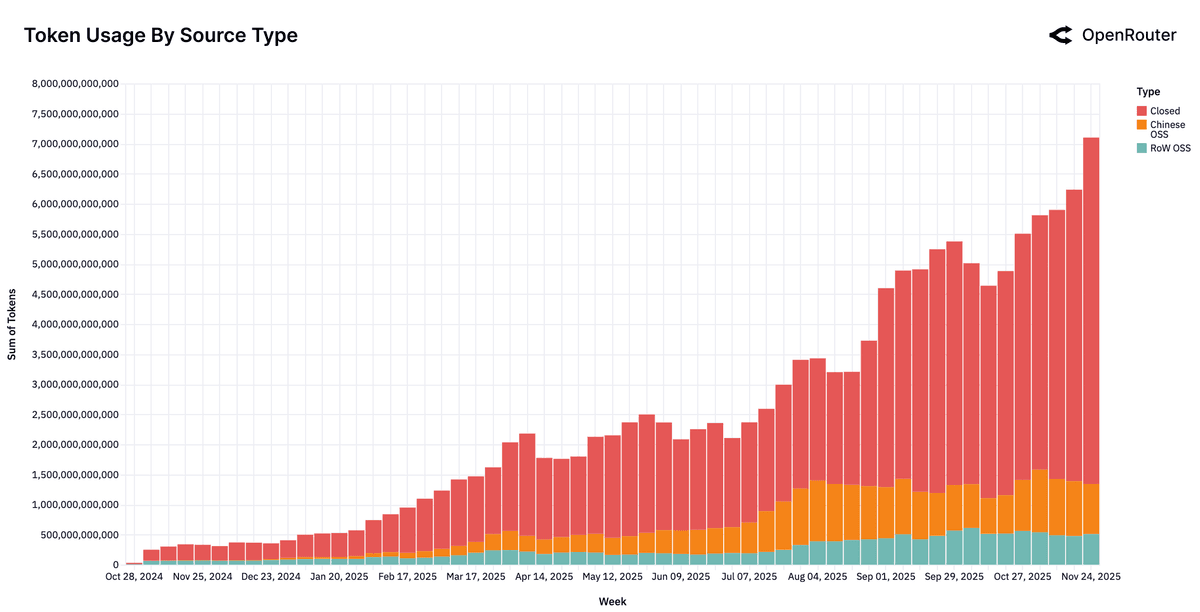
The graph below shows the total number of tokens on the vertical axis. In 2024, the total number of tokens per week was about 500 billion, but in February 2025, it exceeded 1 trillion tokens per week. In September, it exceeded 5 trillion tokens per week, and most recently reached 7 trillion tokens per week.
Closed models are used because of their reliability and performance, while open models tend to be the choice for those looking for cost-effectiveness, transparency, and customization.
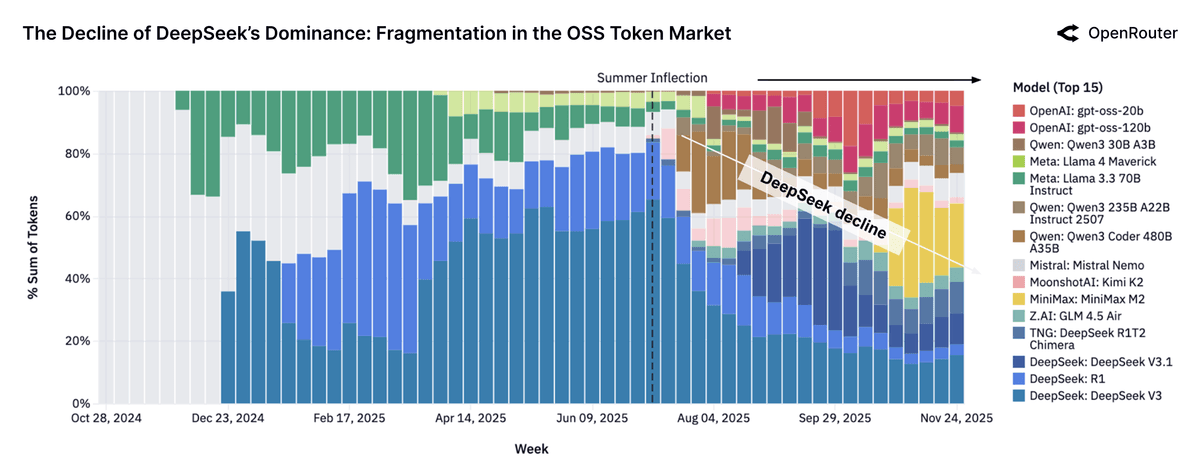
When OpenRouter analyzed token usage across all models from November 2024 to November 2025, DeepSeek was the most used open model, with a total of 14.37 trillion tokens.
However, looking at the graph showing the trends of the 15 most popular models, we can see that the popularity of the DeepSeek series, shown in blue, has been declining since the summer of 2025. This is likely due to the entry of new models with superior capabilities and efficiency. By late 2025, no single model will account for 25% of the tokens of open models.
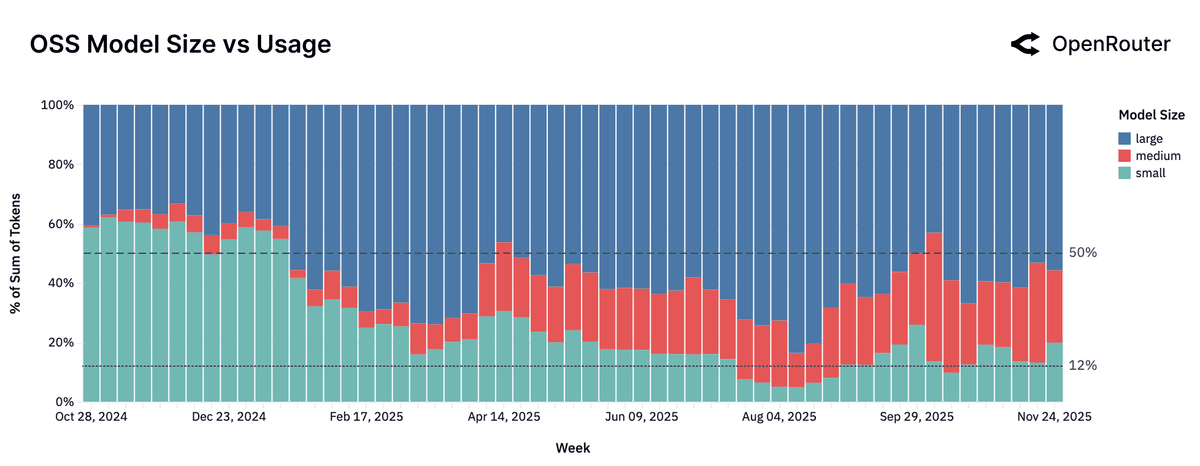
The graph below shows the popularity of models by size. Green indicates small models with fewer than 15 billion parameters, red indicates medium models with 15-75 billion parameters, and blue indicates large models with over 70 billion parameters. We can see that small models have fallen out of favor over the past year, while medium models have risen to prominence.
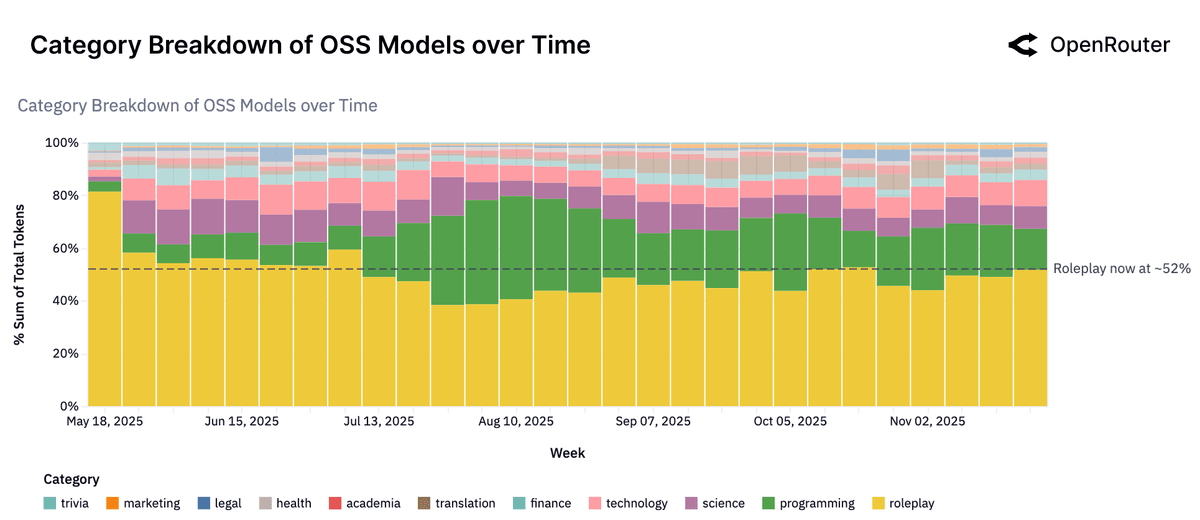
The graph below shows the types of uses for the open model. The most popular activity throughout the year was 'role-playing,' shown in yellow, followed by 'programming (green),' 'science (purple),' and 'technology (pink).' This trend appears to be due to the open model's fewer content filtering restrictions, making it easier to use for creative purposes.
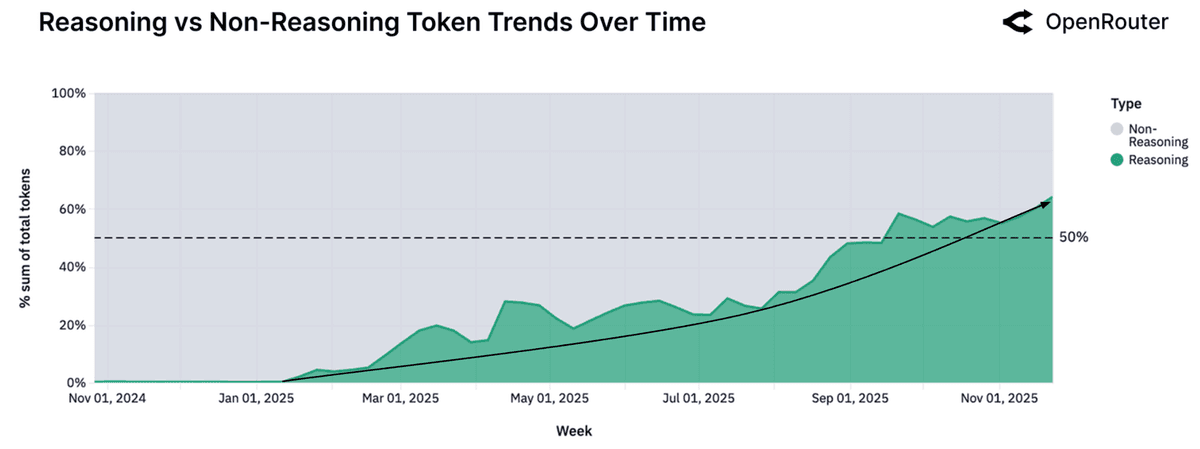
One way to classify AI models is by whether they are inference models that take time but perform deep thinking. Looking at the number of tokens used, inference models have steadily grown in popularity over the past year, and as of November 2025, they have surpassed non-inference models to account for the majority.
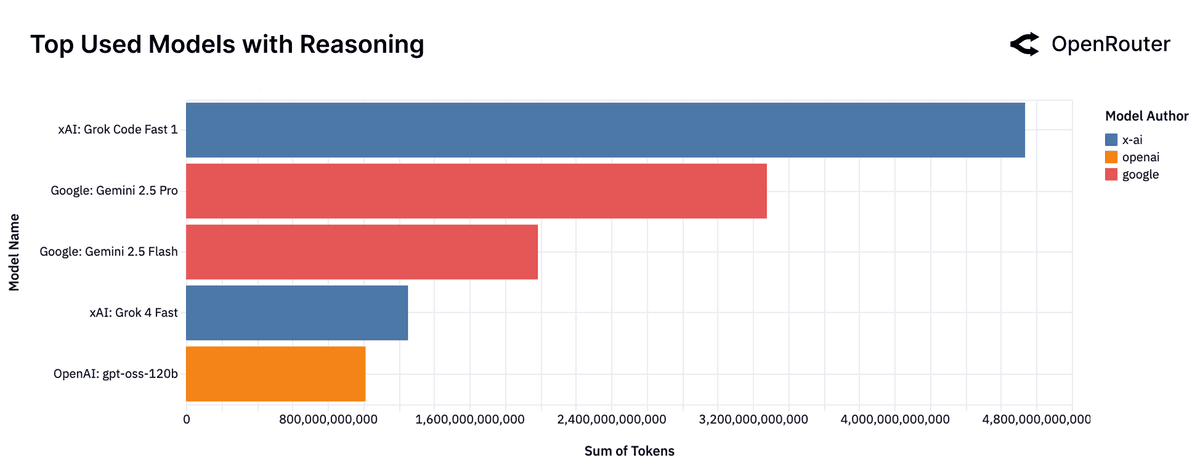
The most popular inference model is xAI's Grok Code Fast 1, followed by Google's Gemini 2.5 Pro and Gemini 2.5 Flash, xAI's Grok 4 Fast, and OpenAI's gpt-oss-120b.
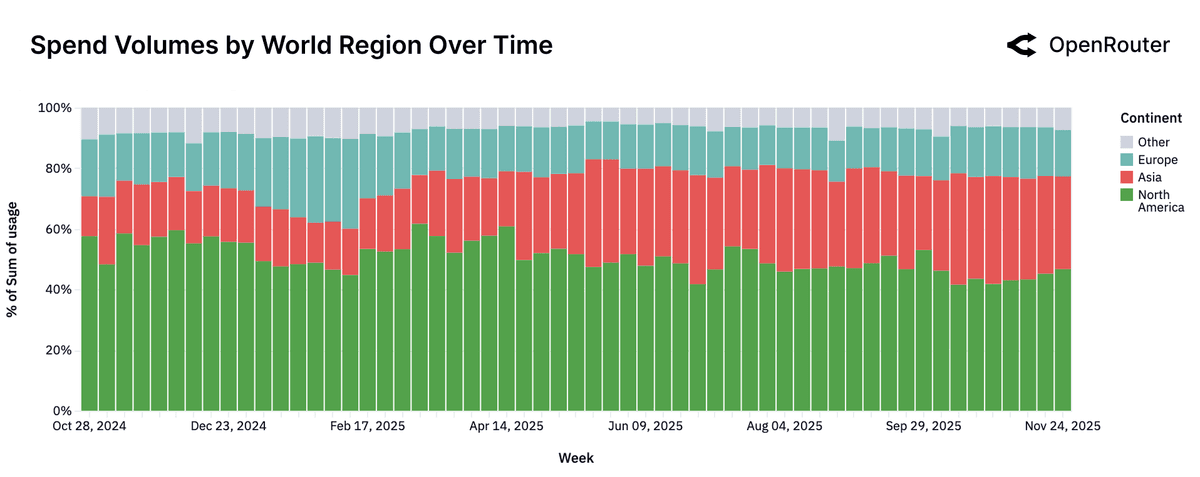
By region, North America had the highest percentage of users, followed by Asia, Europe, and others. By country, the United States came in first with 47.17%, followed by Singapore with 9.21%, and Germany with 7.51%. China came in fourth with 6.01%, and Japan came in ninth with 1.77%.
Related Posts:


in AI, Posted by logc_nt