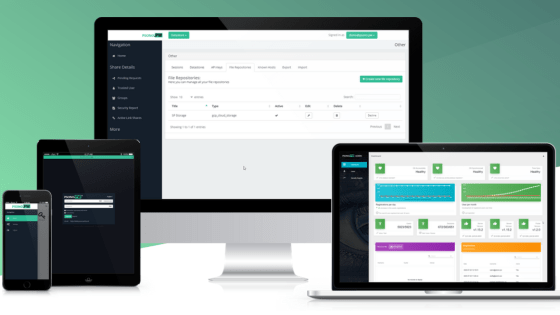
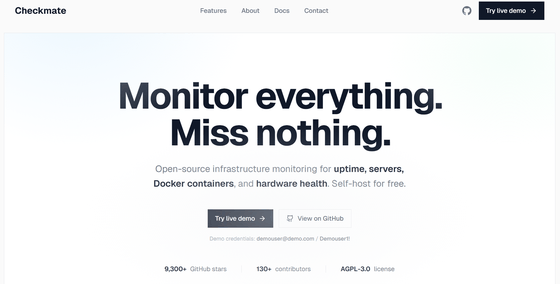
Checkmate is a free, open-source, self-hostable service that monitors website uptime, page load speed, and remote server CPU/disk/memory/disk status, and automatically publishes a status page.
While there are many tools for monitoring server status and services, Checkmate is a free, open-source monitoring tool for small and medium-sized websites that allows you to build a lightweight server monitoring system using
Checkmate - Open source infrastructure monitoring
https://checkmate.so/
bluewave-labs/Checkmate: Checkmate is an open-source, self-hosted tool designed to track and monitor server hardware, uptime, response times, and incidents in real-time with beautiful visualizations.
bluewave-labs/capture: An open source hardware monitoring agent for Checkmate
https://github.com/bluewave-labs/capture
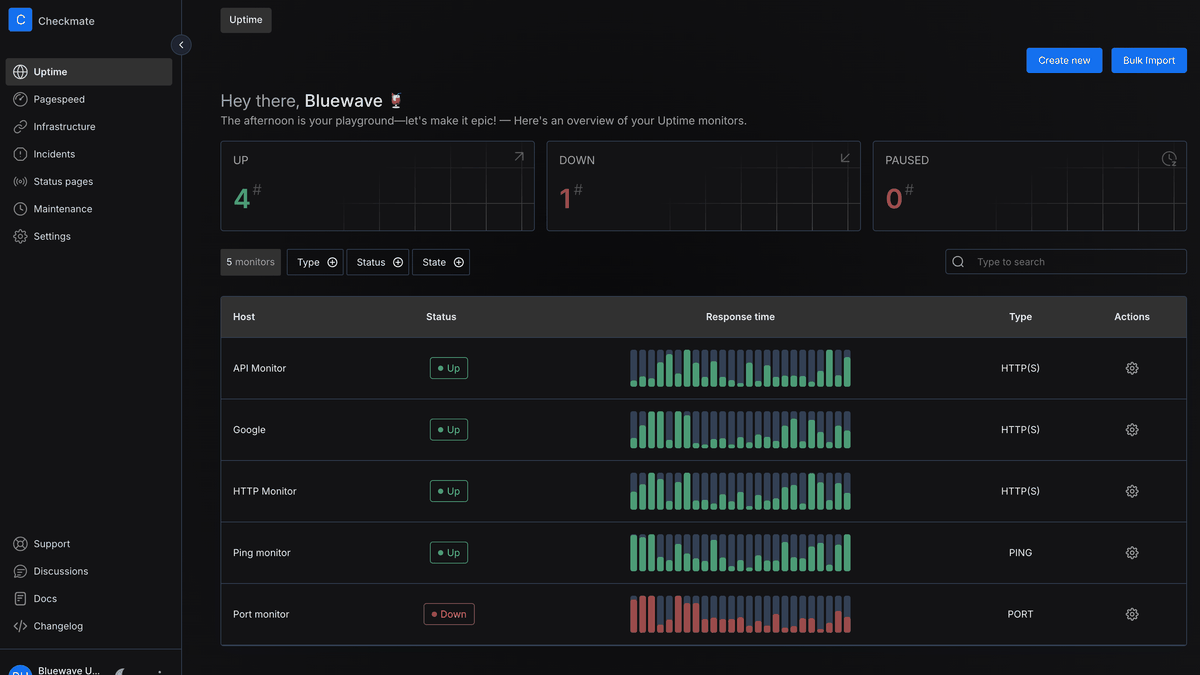
◆Overview of Checkmate
Uptime monitoring
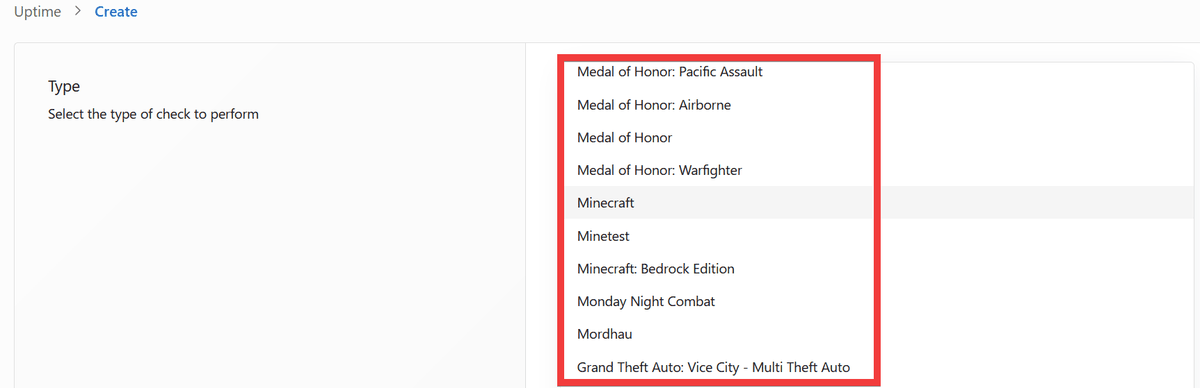
It monitors the operational status of HTTP , HTTPS , Ping , Docker , Port , Game, gRPC , and WebSocket , and notifies you if an error occurs.
Game monitoring allows you to accurately monitor the status of your game server by specifying the host server and the game name, such as '
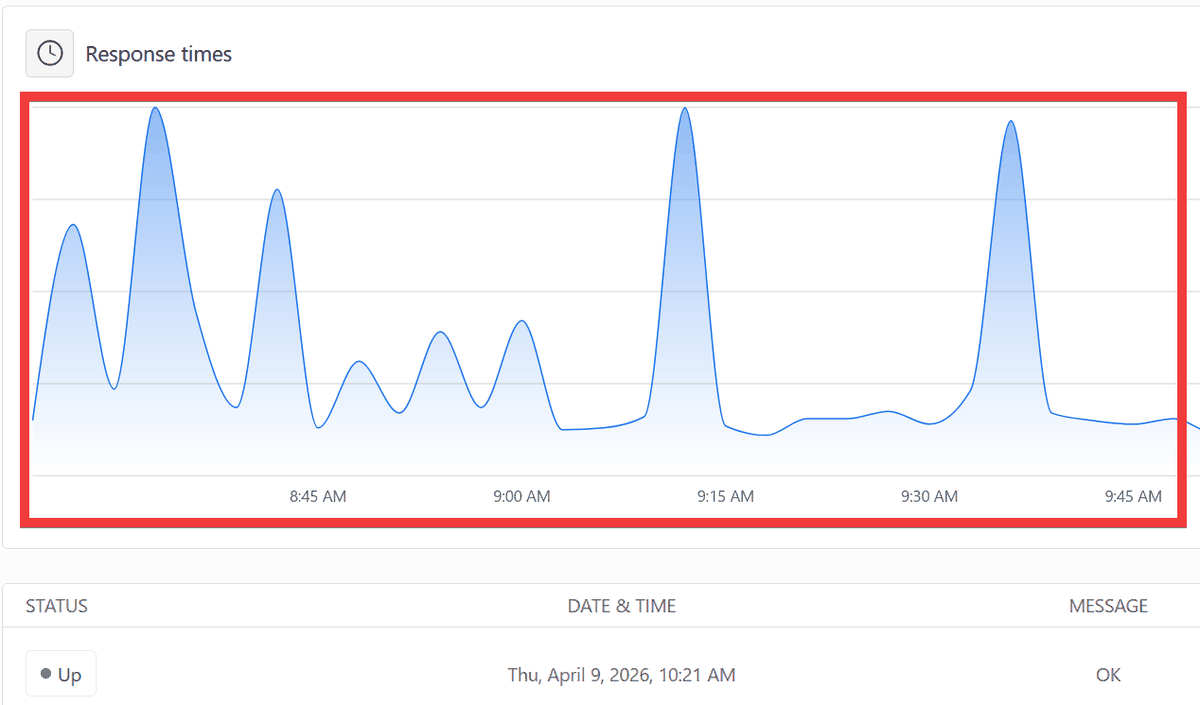
・Response time measurement
By displaying the data in a graph, it is possible to understand how response times change over time.
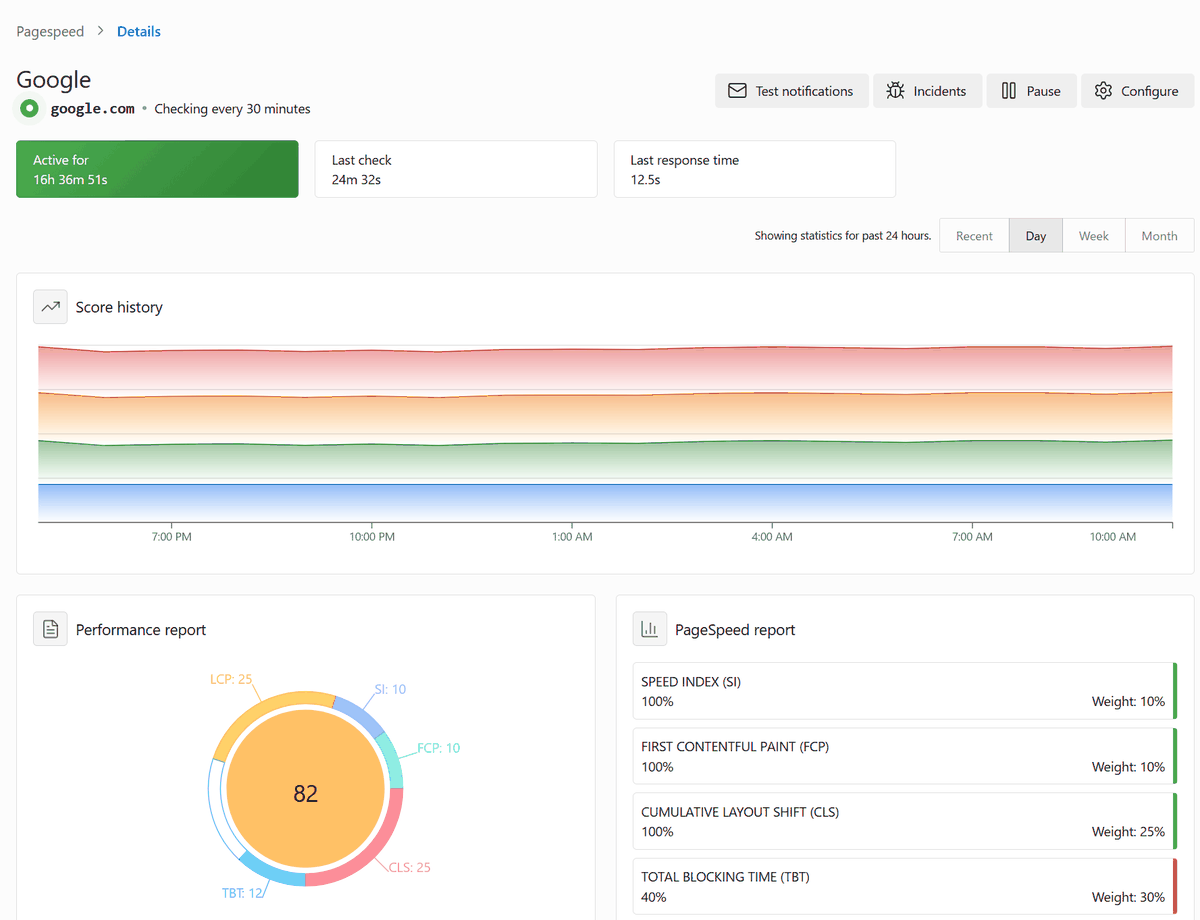
Page speed measurement and evaluation
By using Lighthouse to measure page loading times and recording website performance metrics such as CLS and LCP , it's possible to evaluate the effectiveness of any implemented measures before and after implementation.
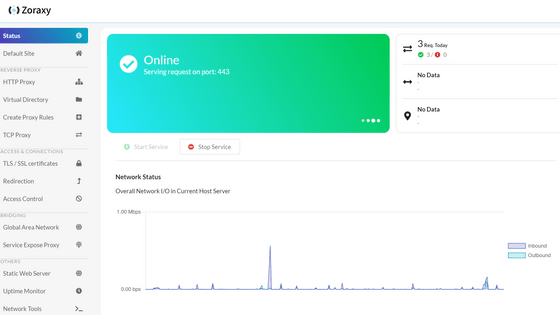
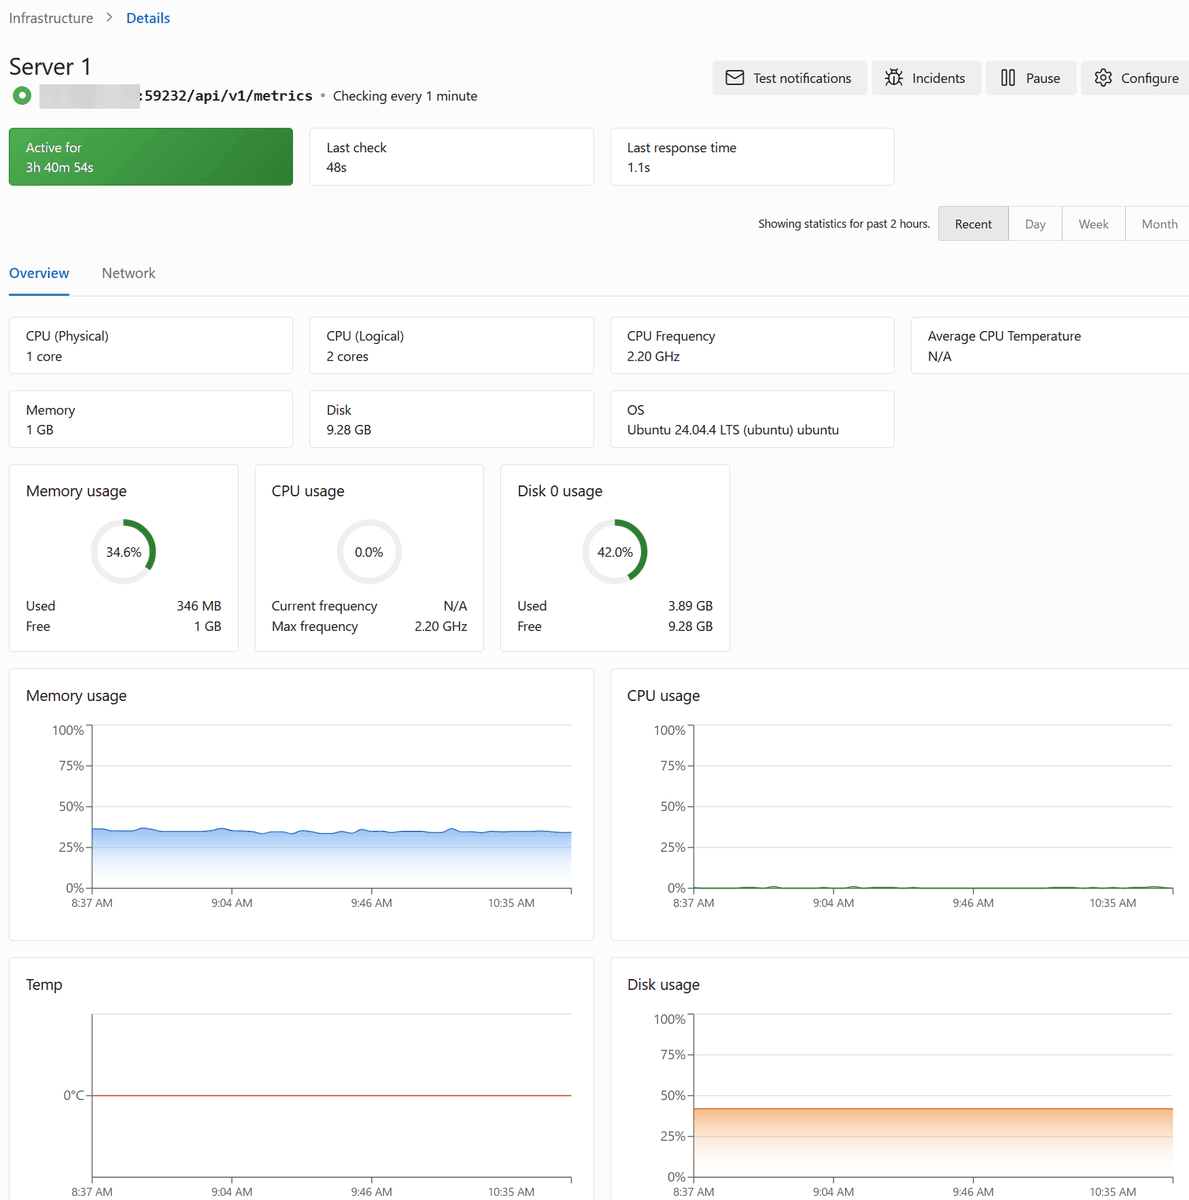
• Server status monitoring
It monitors CPU, memory, disk, and network usage, and notifies you if thresholds are exceeded or errors occur.
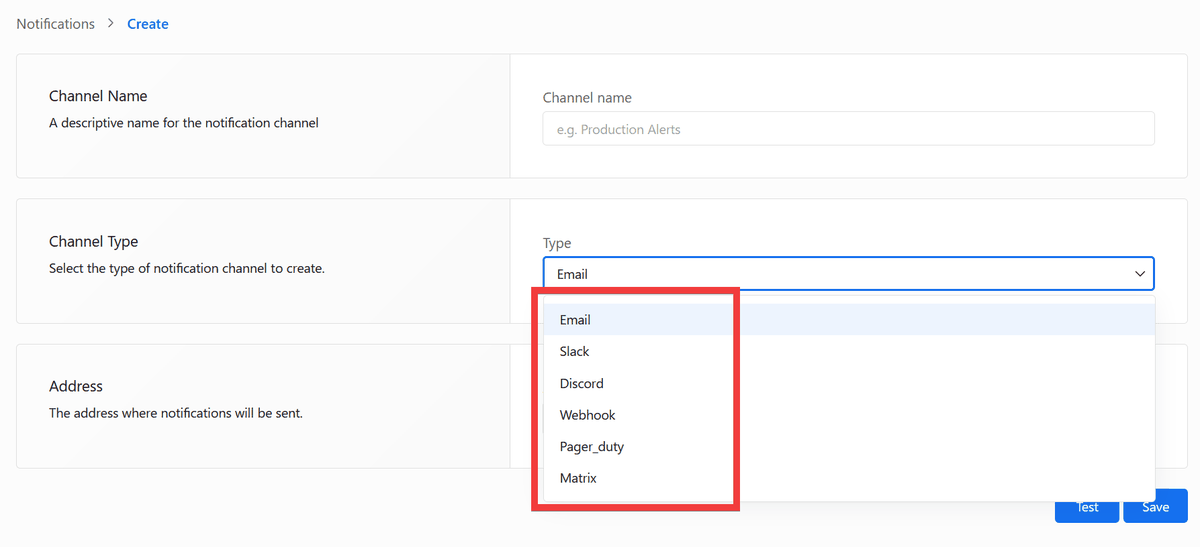
・Notification method
Email,
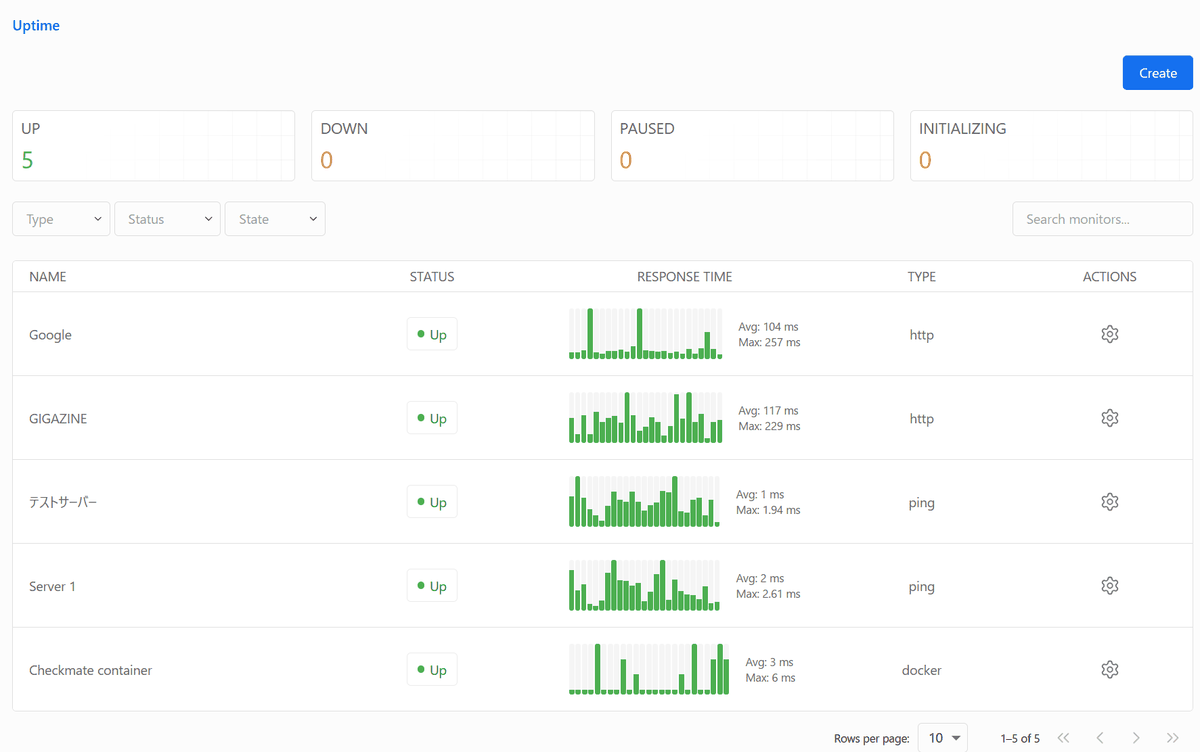
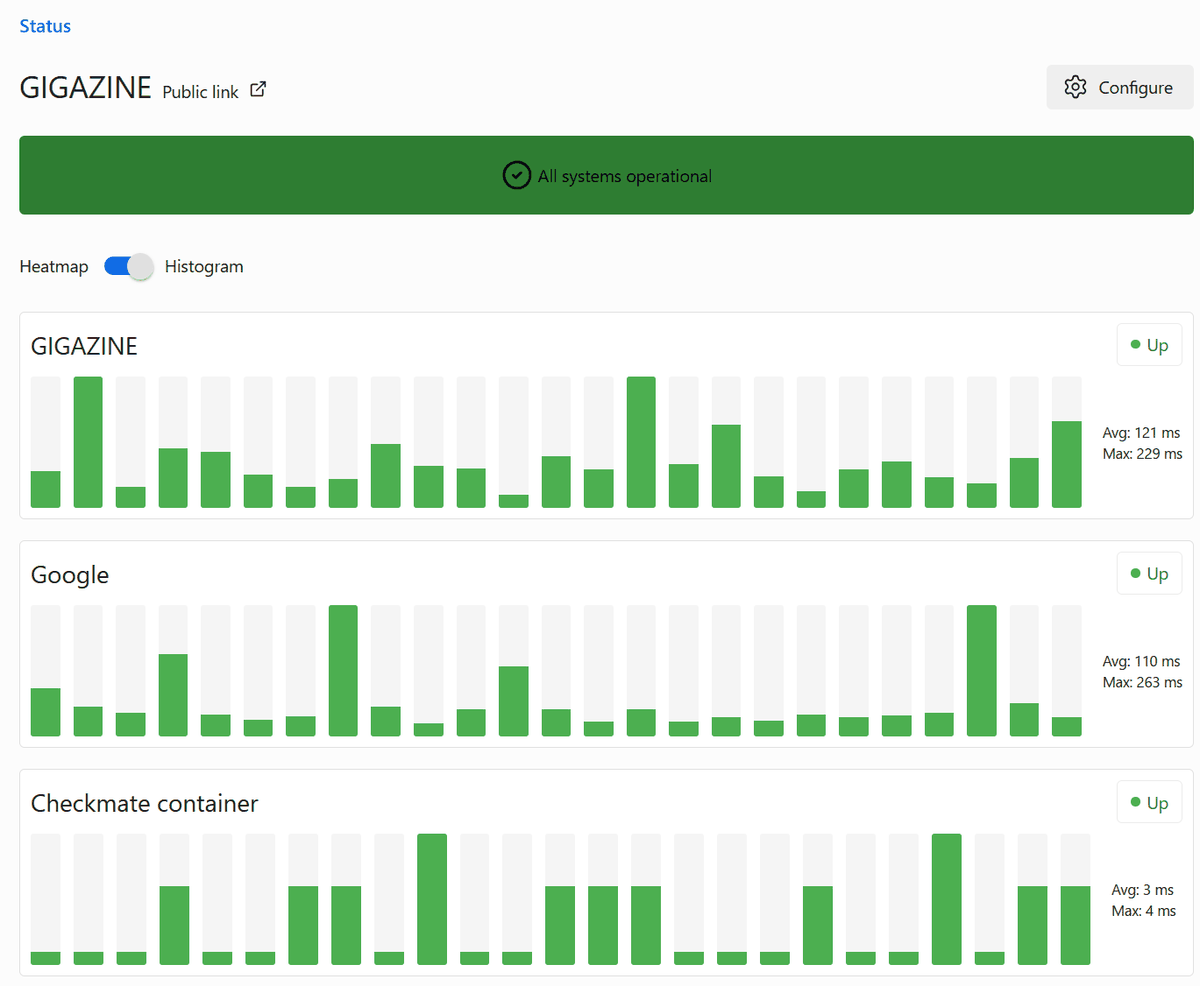
Status page
You can create a list of monitored services and generate a status page that allows you to see their operational status at a glance.
◆The origins and direction of Checkmate
On the social news site Hacker News , the developer discusses the necessary functions for a server monitoring system, gathering feedback from the community and incorporating it into the design and implementation as development progresses. To differentiate it from other monitoring tools, the focus is on ease of installation and consolidating essential information.
◆ How to install Checkmate
The following items need to be prepared in advance:
• Server: A server that self-hosts Checkmate.
• Domain name: The domain name used to obtain an SSL certificate.
• Docker : A container execution environment for running Checkmate containers.
• Nginx Proxy Manager : A reverse proxy for exposing Checkmate. It uses Let's Encrypt to obtain SSL/TLS certificates and enables secure access via HTTPS.
• Container sharing network: A network that allows Checkmate and Nginx Proxy Manager containers to run on the same network.
This time, we will set up an environment where Docker and Nginx Proxy Manager can be used on Ubuntu on a Google Cloud VM instance. Navigate to your working folder and download docker-compose.yaml.
 curl -L -o docker-compose.yaml \
 https://raw.githubusercontent.com/bluewave-labs/checkmate/develop/docker/dist-mono/docker-compose.yaml
Edit the docker-compose.yaml file.
 services:
 Server:
 image: ghcr.io/bluewave-labs/checkmate-backend-mono:latest
 pull_policy: always
 restart: always
 ports:
 - '52345:52345'
 environment:
 - UPTIME_APP_API_BASE_URL=https://[domain name]:52345/api/v1
 - UPTIME_APP_CLIENT_HOST=https://[domain name]
 - DB_CONNECTION_STRING=mongodb://mongodb:27017/uptime_db
 - CLIENT_HOST=https://[domain name]
 # Please set JWT_SECRET.
 # openssl rand -hex 32
 - JWT_SECRET=【Output of the above command】
 but_on:
 - mongodb
 networks:
 - default
 - proxy_shared

 mongodb:
 image: ghcr.io/bluewave-labs/checkmate-mongo:latest
 restart: always
 command: ['mongod', '--quiet', '--bind_ip_all']
 volume:
 - ./mongo/data:/data/db
 health check:
 test: ['CMD', 'mongosh', '--eval', 'db.adminCommand('ping')', '--quiet']
 interval: 5s
 Timeout: 30s
 start_period: 0s
 start_interval: 1s
 Retries: 30
 networks:
 - default

 networks:

proxy_shared:
 external: true
Start the Checkmate container.
docker compose up -d
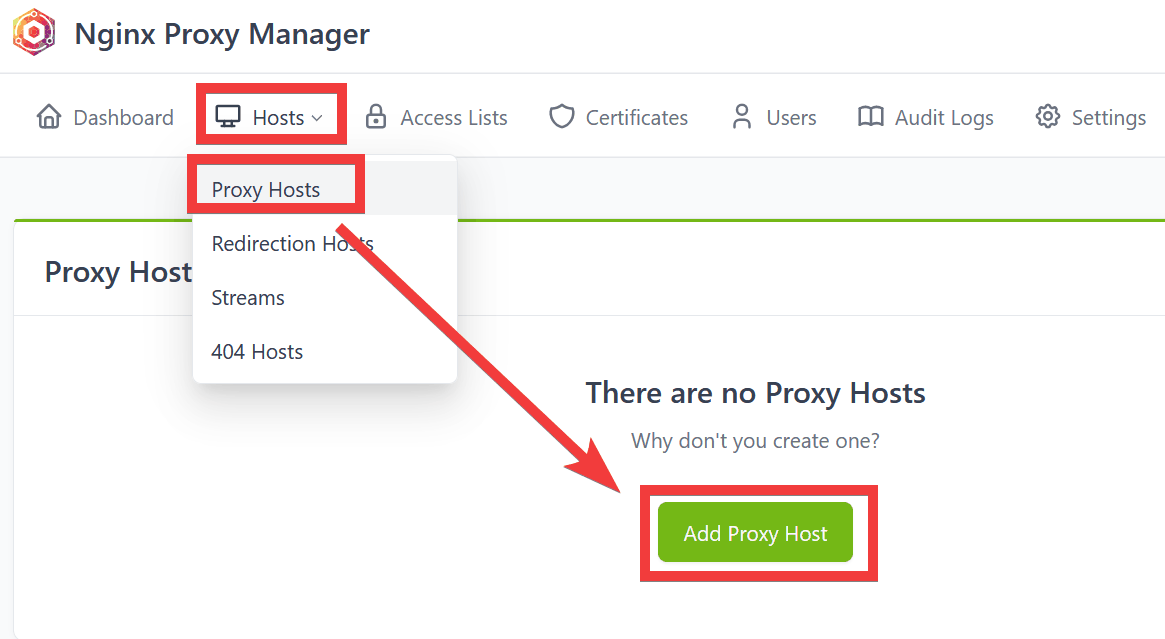
To configure the reverse proxy, access the Nginx Proxy Manager management screen in your browser, click 'Hosts,' then 'Proxy Hosts,' and then click 'Add Proxy Host.'
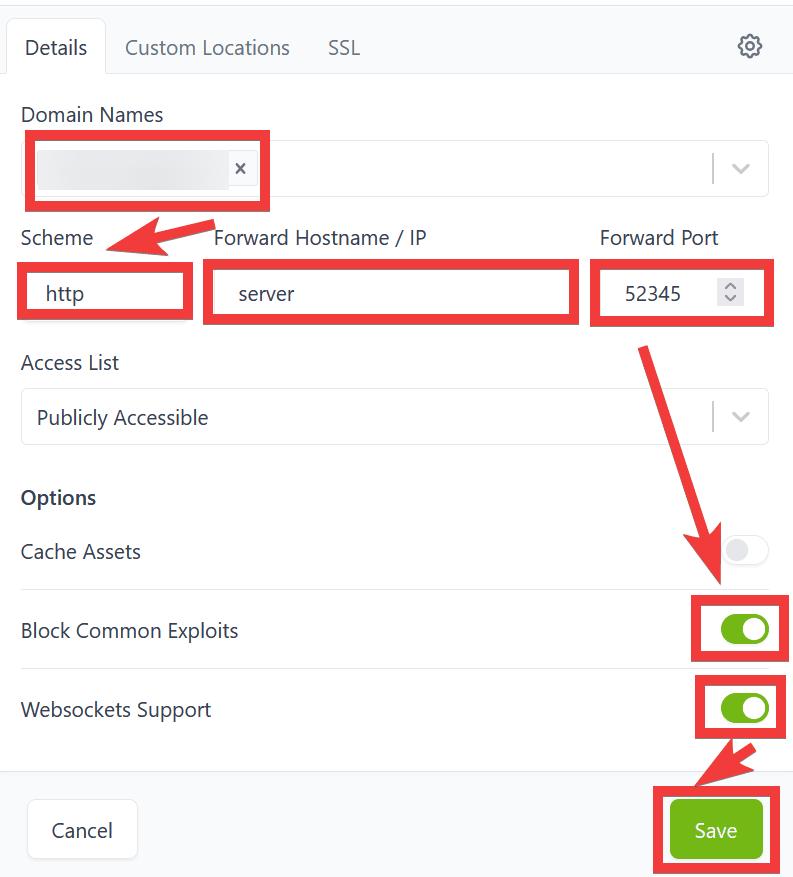
Enter your domain name in 'Domain Names,' select 'http' for 'Scheme,' enter 'server' in 'Forward Hostname/IP,' enter '52345' in 'Forward Port,' turn on the toggles for 'Block Common Exploits' and 'Websockets Support,' and click 'Save.'
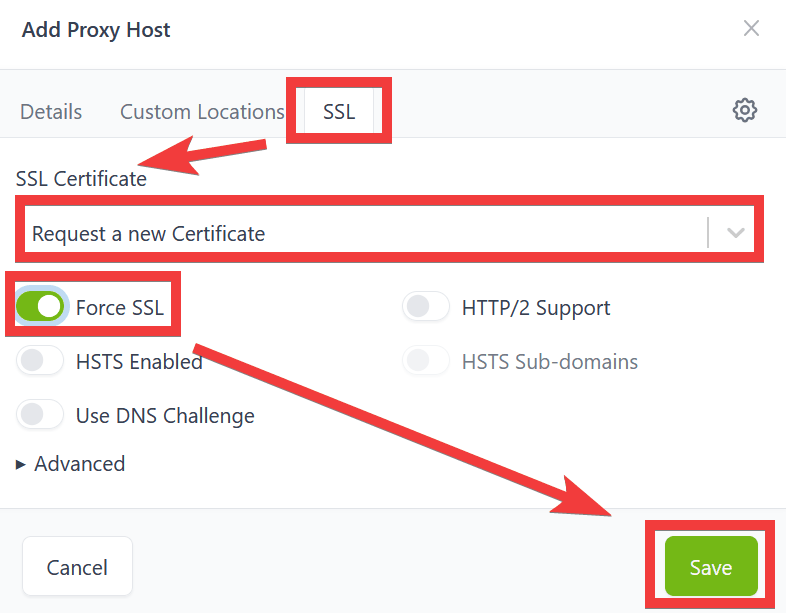
Select 'SSL' in the tab, select 'Request a new Certificate' for 'SSL Certificate', turn the 'Force SSL' toggle to 'On', and click 'Save'.
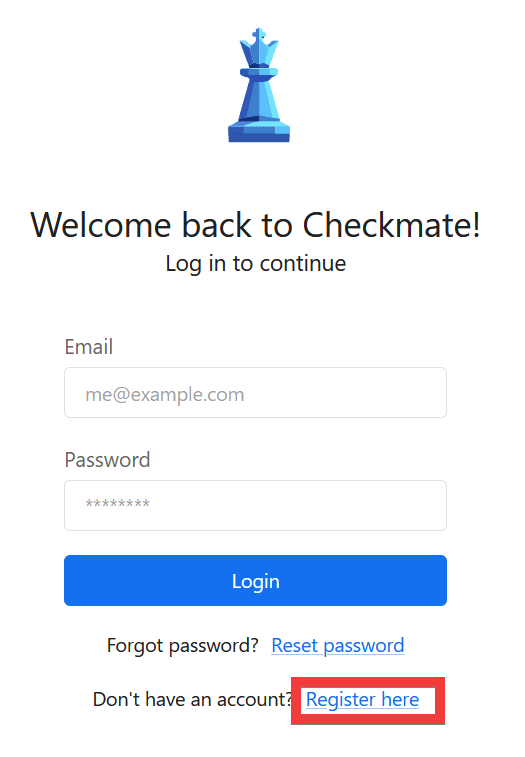
When you access the domain name you set, the Checkmate login screen will appear, so click 'Register here'.
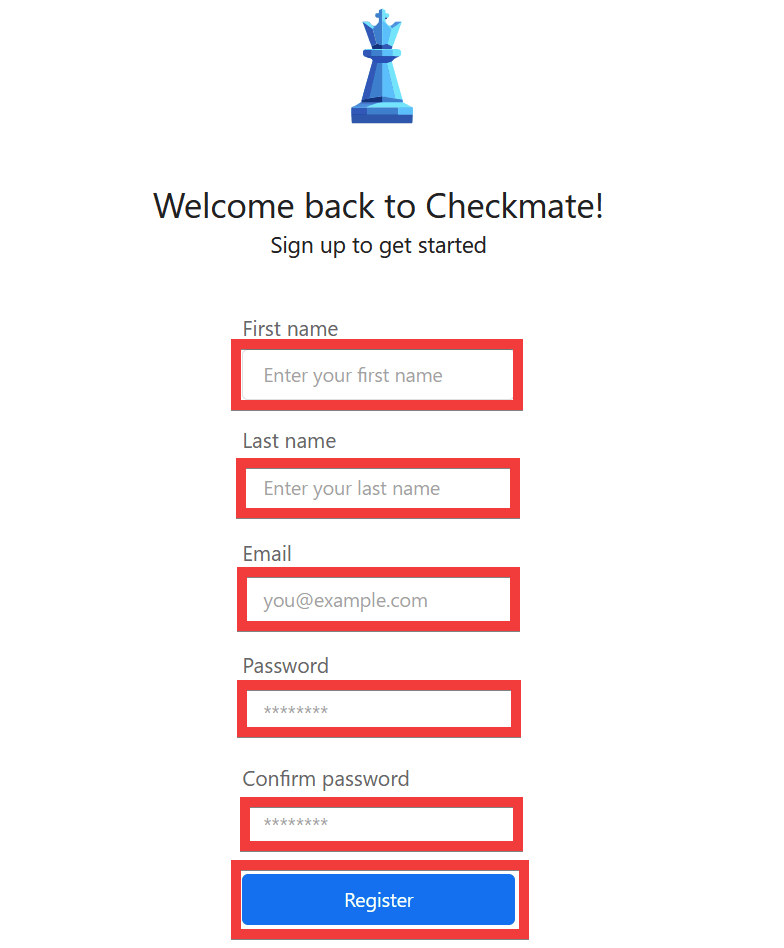
Enter your desired name in 'First name' and 'Last name,' enter your email address in 'Email,' enter your password in 'Password' and 'Confirm password,' and then click 'Register.'
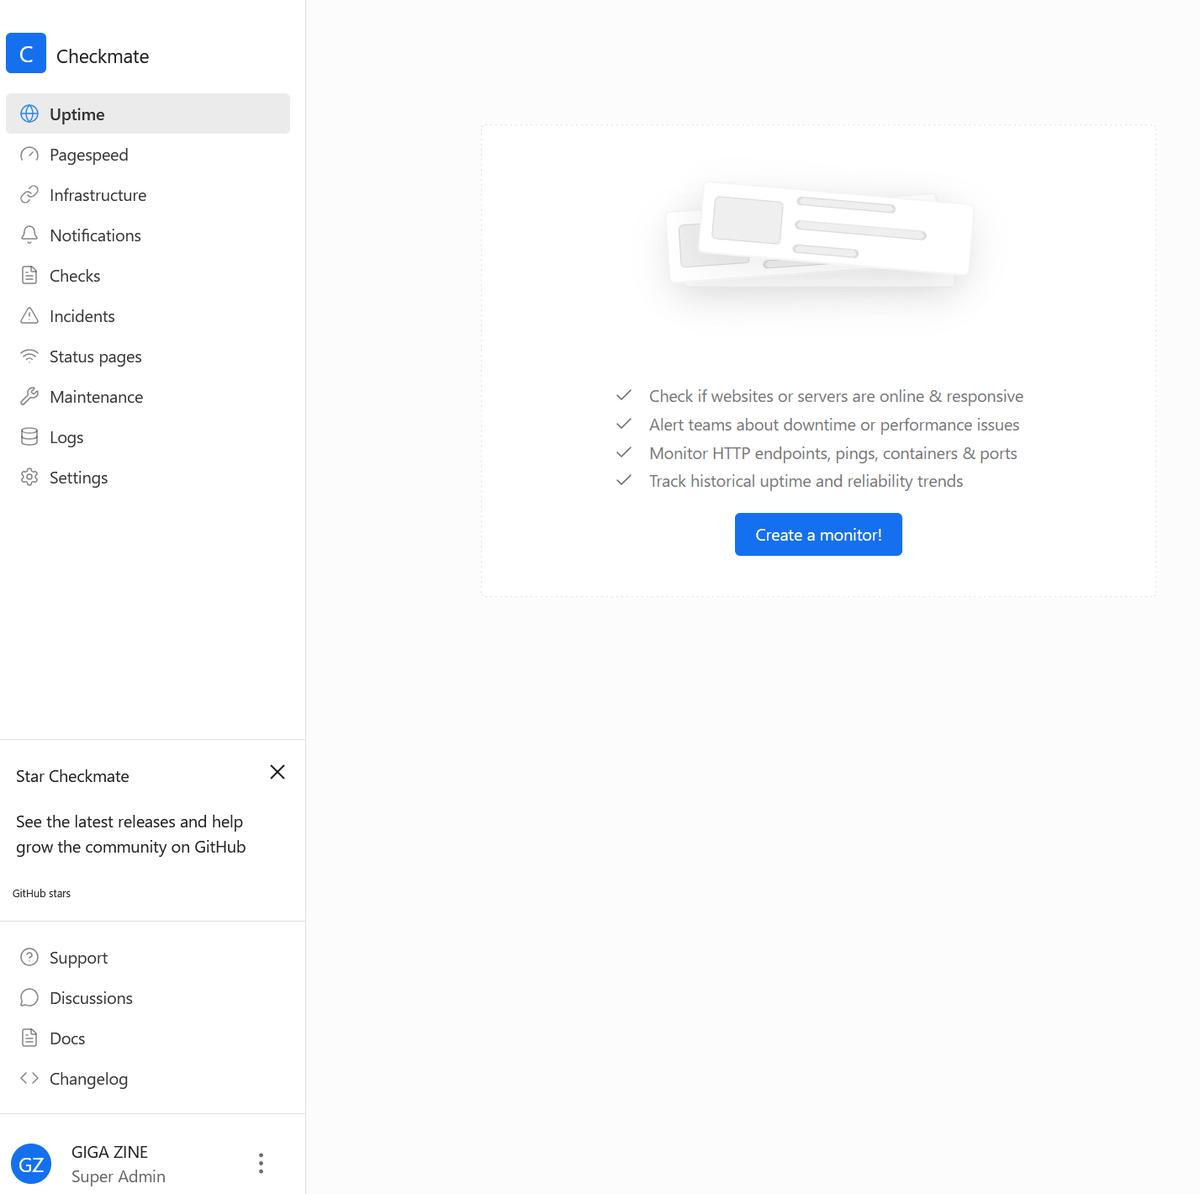
Once registration is complete, the administration screen will be displayed.
◆ How to install Capture
To obtain internal server information such as CPU usage and memory usage, install
 # Please set API_SECRET.
 # openssl rand -hex 32

 docker run -d \
 -v /etc/os-release:/etc/os-release:ro \
 -p 59232:59232 \
 -e API_SECRET=【Output of the above command】 \
 ghcr.io/bluewave-labs/capture:latest
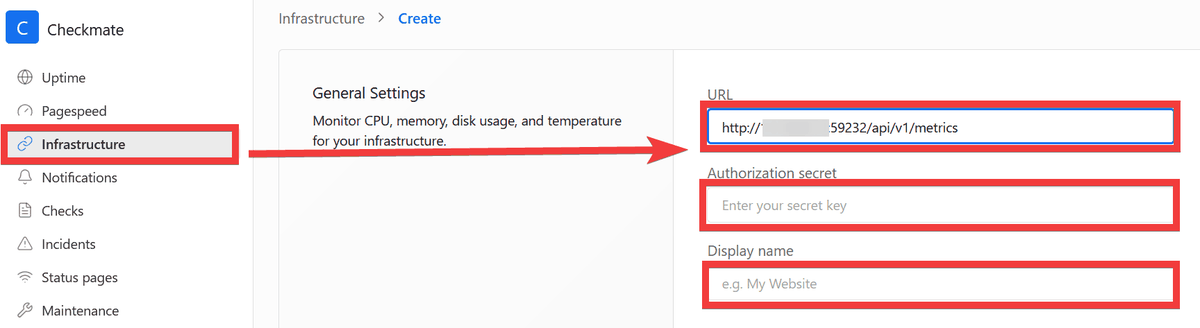
From the Checkmate management screen, click 'Infrastructure,' enter 'http://[IP address of the server to be monitored]:59232/api/v1/metrics' in 'URL,' enter the value set in API_SECRET in 'Authorization secret,' and enter a name of your choice in 'Display name.'
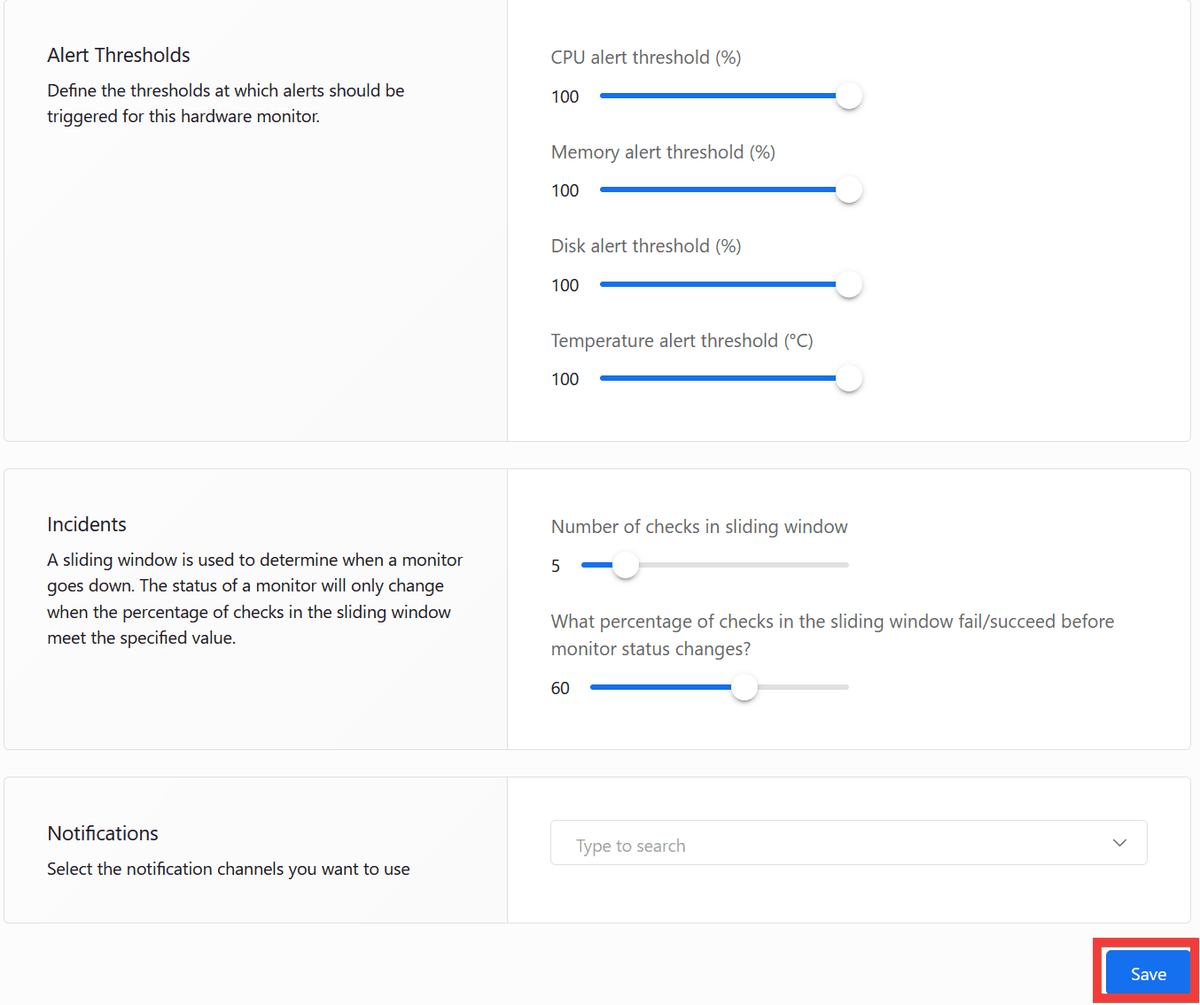
Click 'Save' at the bottom of the settings form to save your settings.
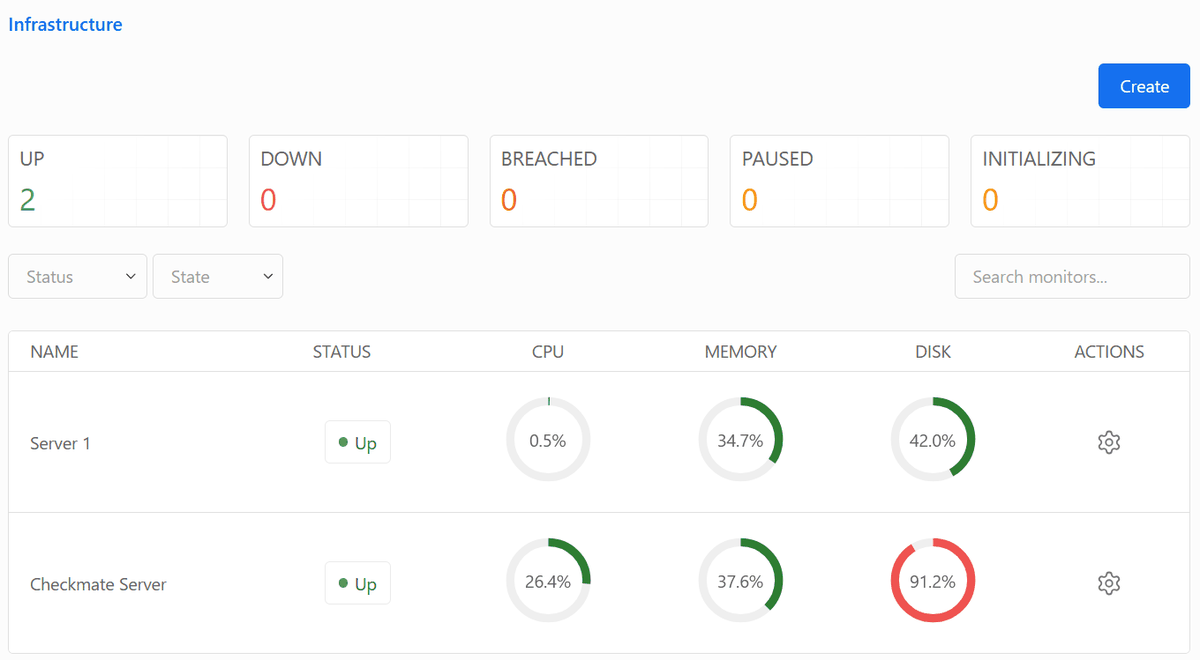
If the data is displayed in the list, it was successful.
In cases where the provided features are sufficient and customization is not required, a simple monitoring system like this, which is easy to implement, is more convenient. It can fulfill requests such as 'easily monitor all servers at once' and 'get a clear overview of the operational status of the services being used' with a single tool.
Related Posts: