'Strange Attractors' lets you visualize the 'butterfly effect' in real life, using Three.js to visualize subtle parameter changes in 3D.
The phenomenon where a small change to an initial state causes a large change in the subsequent state is called the '
Strange Attractors | Shashank Tomar
https://blog.shashanktomar.com/posts/strange-attractors
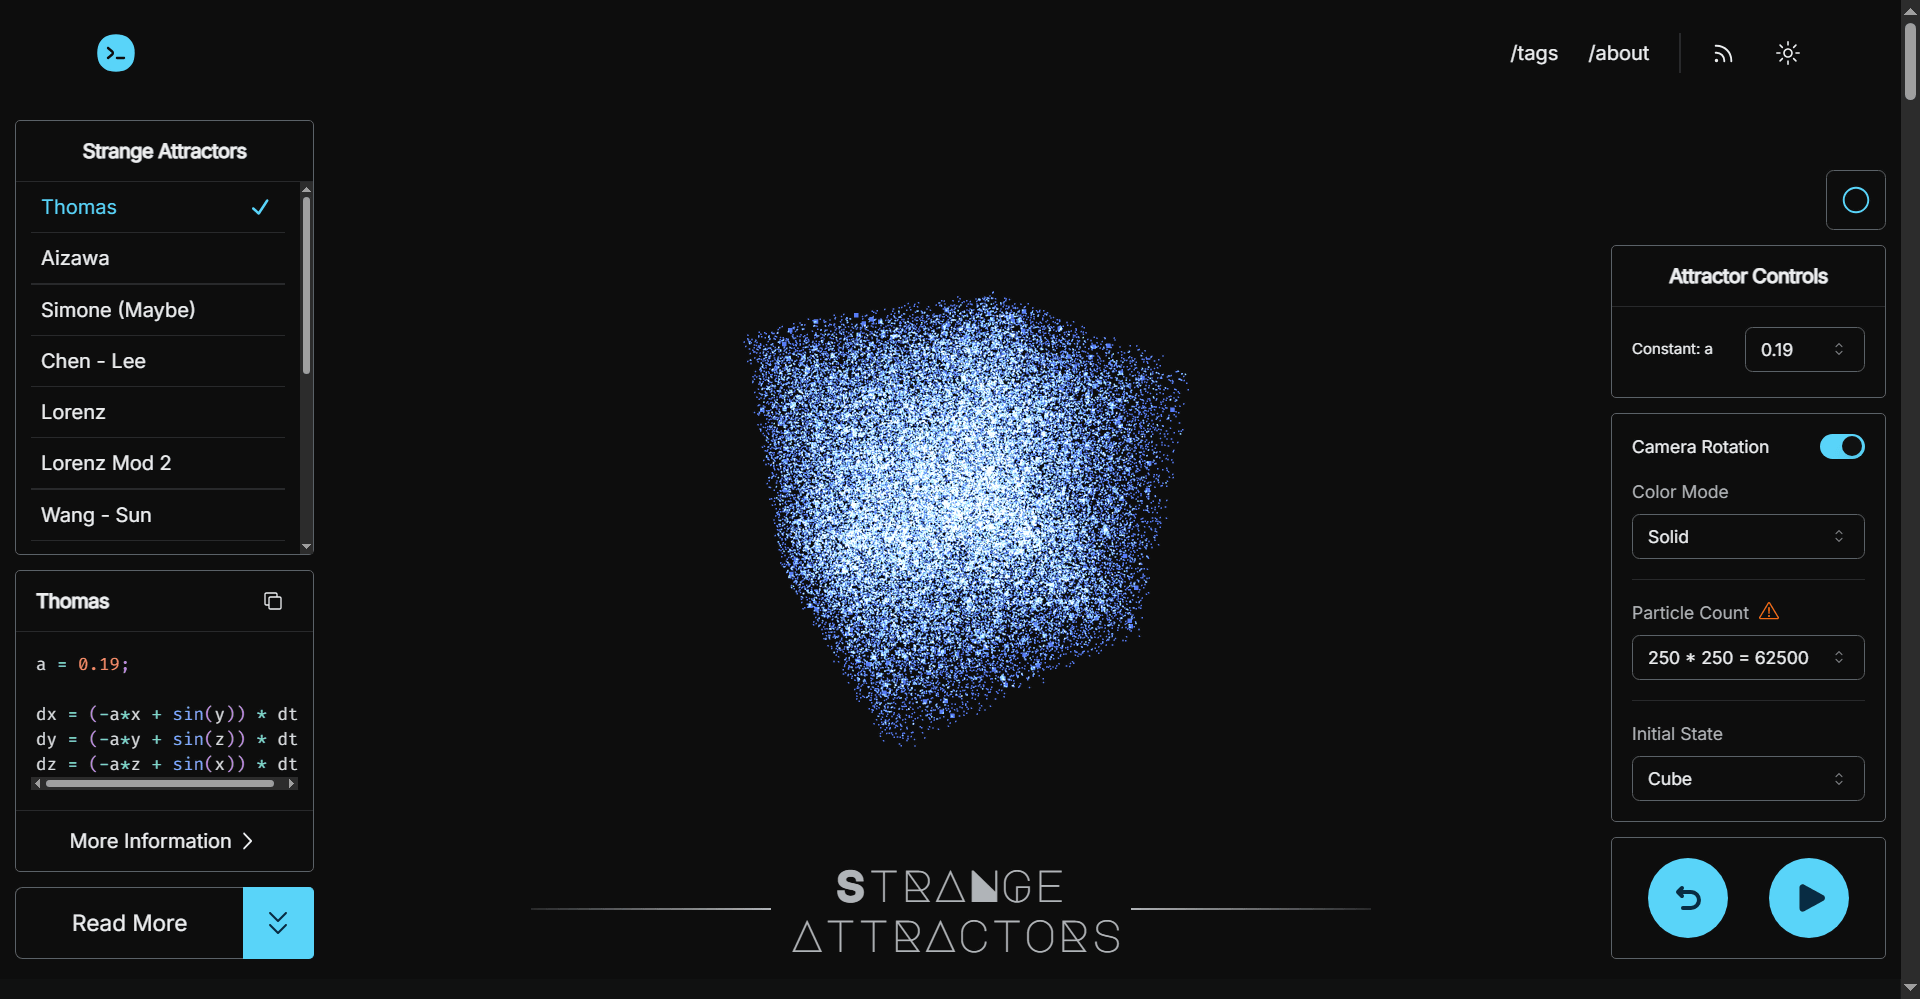
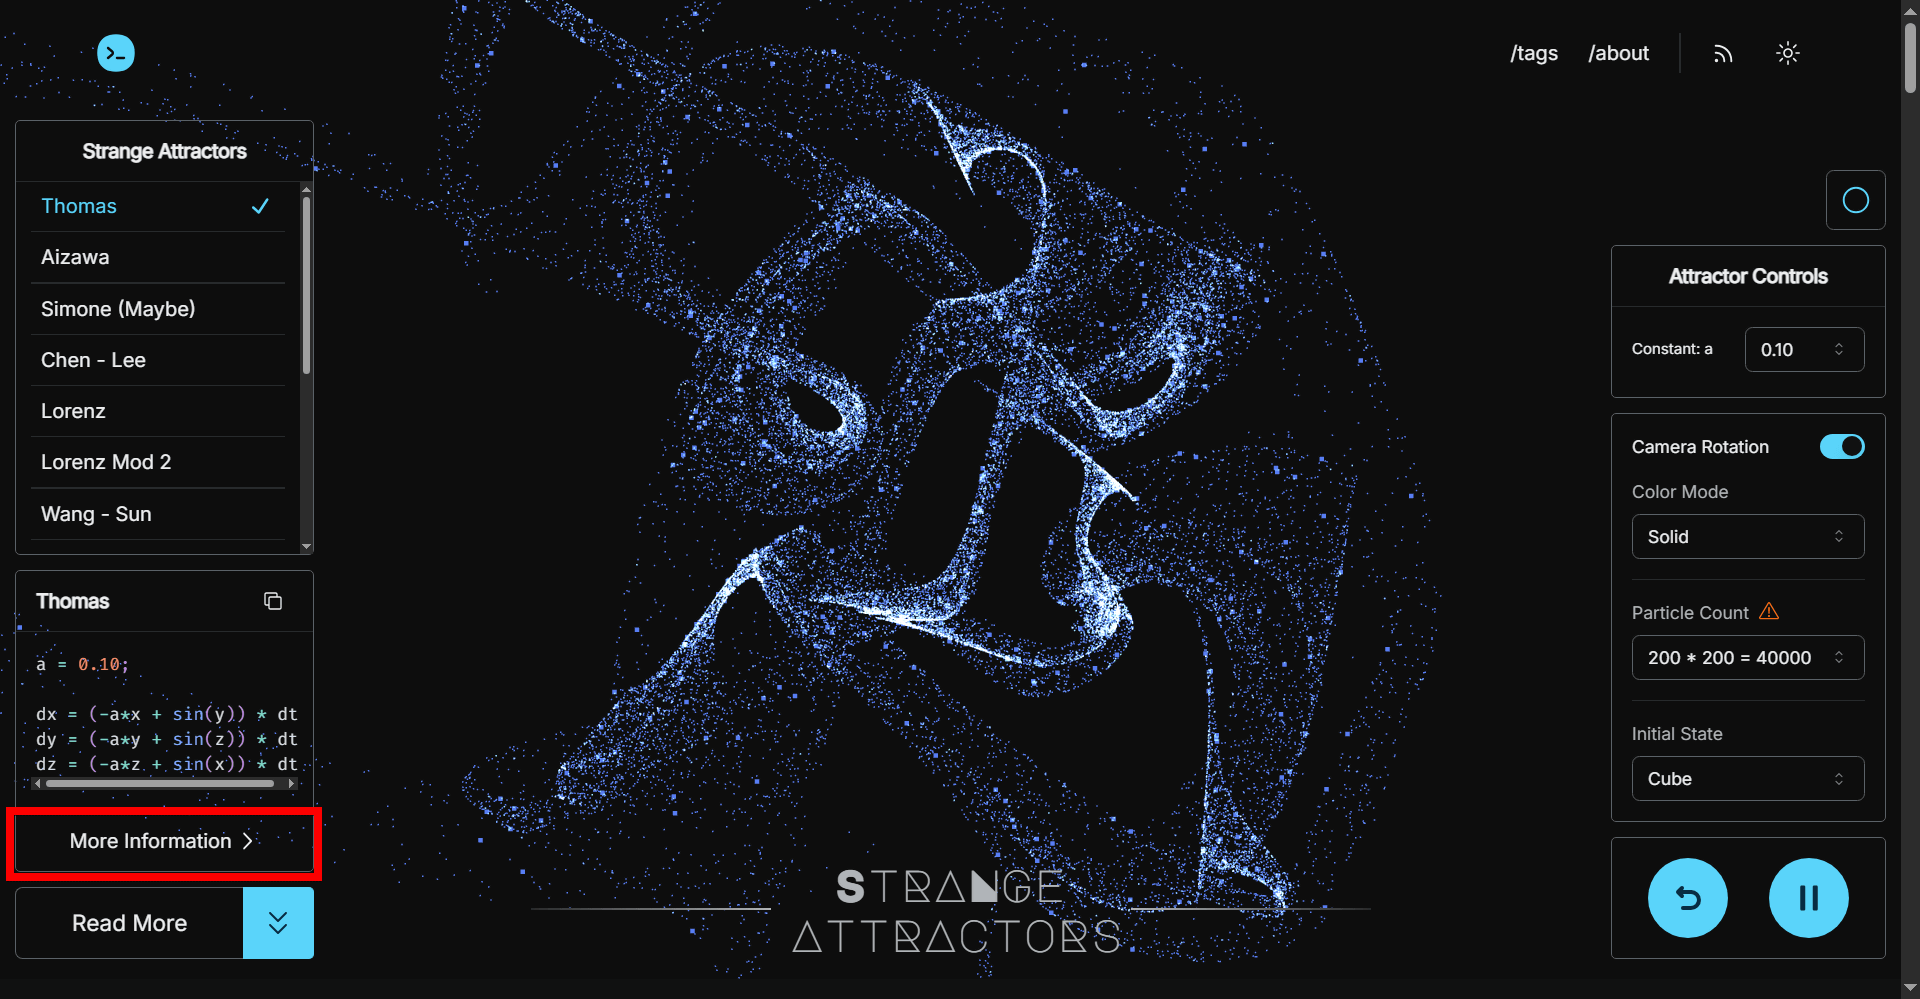
This is what it looks like when you access Strange Attractors. Countless points are gathered together to form a cube. Normally, the behavior of points is defined by a differential equation, and the locus drawn in topological space, that is, the attractor, converges or diverges to a single point. However, there are also attractors that draw strange shapes, and these are called 'strange attractors.'
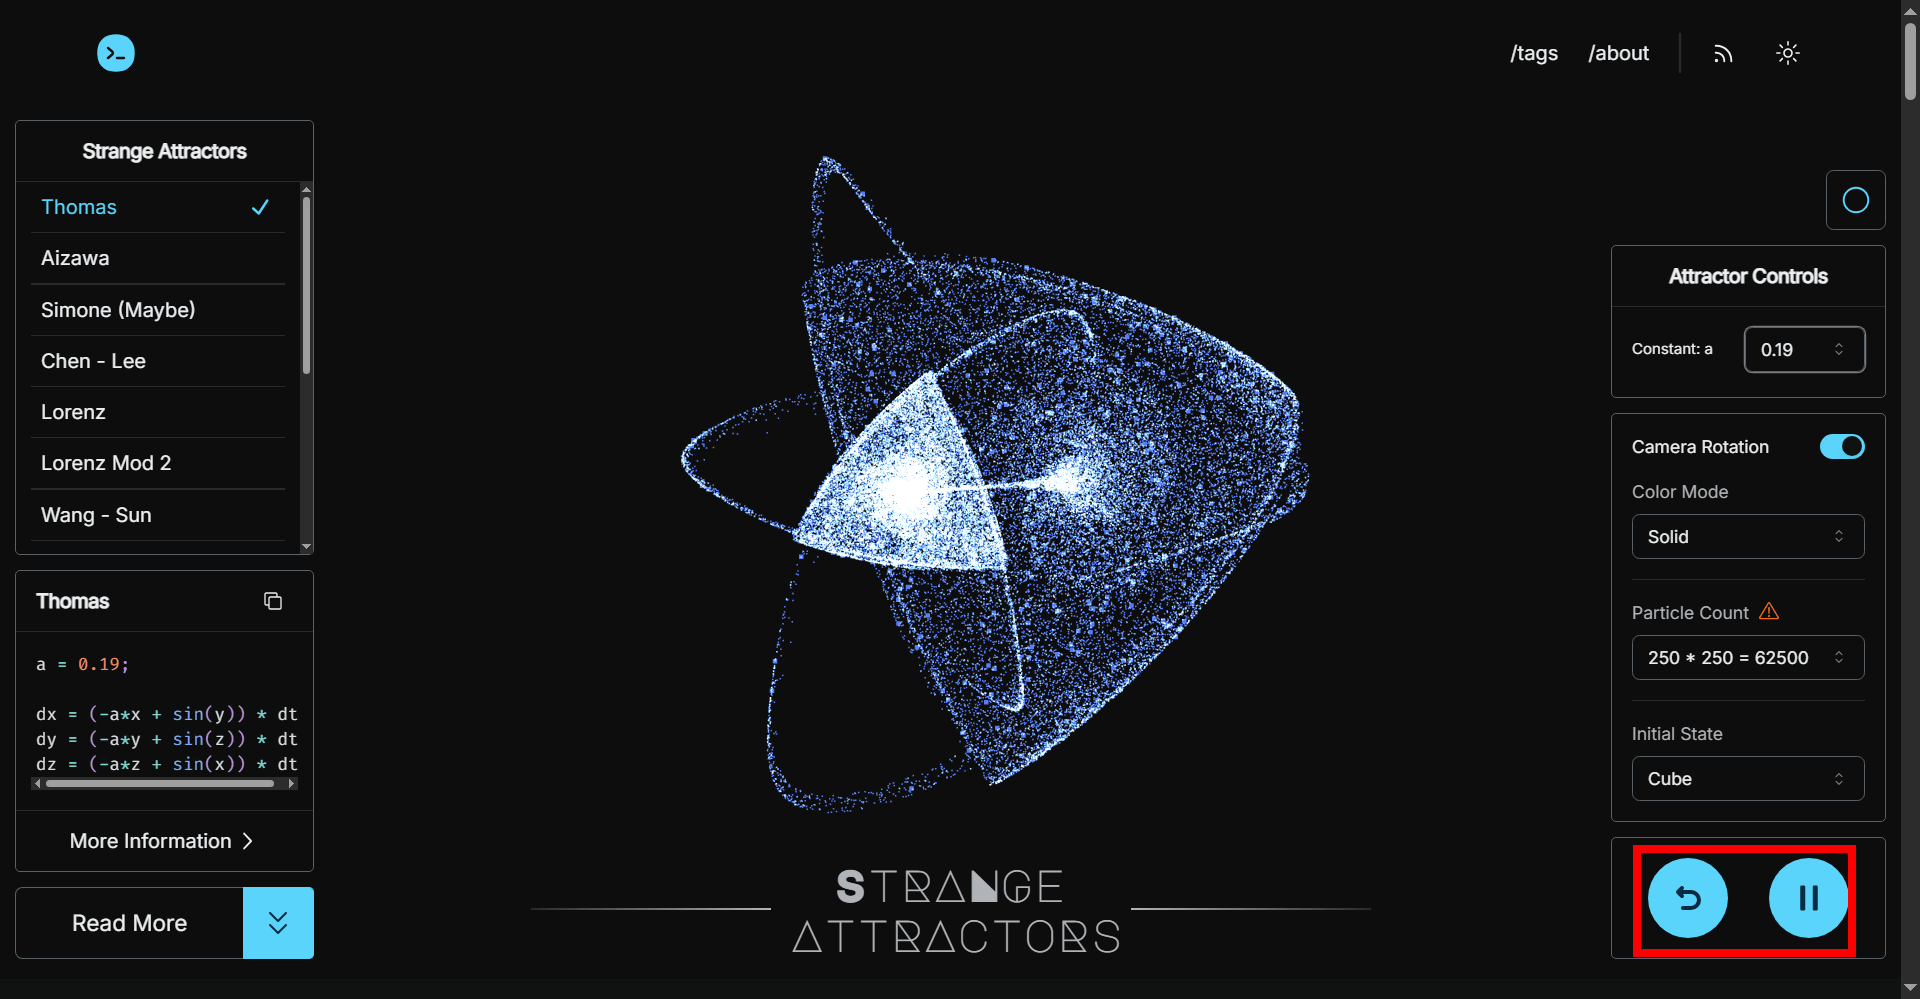
Of the two buttons at the bottom right, clicking the play button on the right will play the animation, and the coordinates of each point will change over time. You can replay the animation from the beginning by clicking the arrow button on the left.
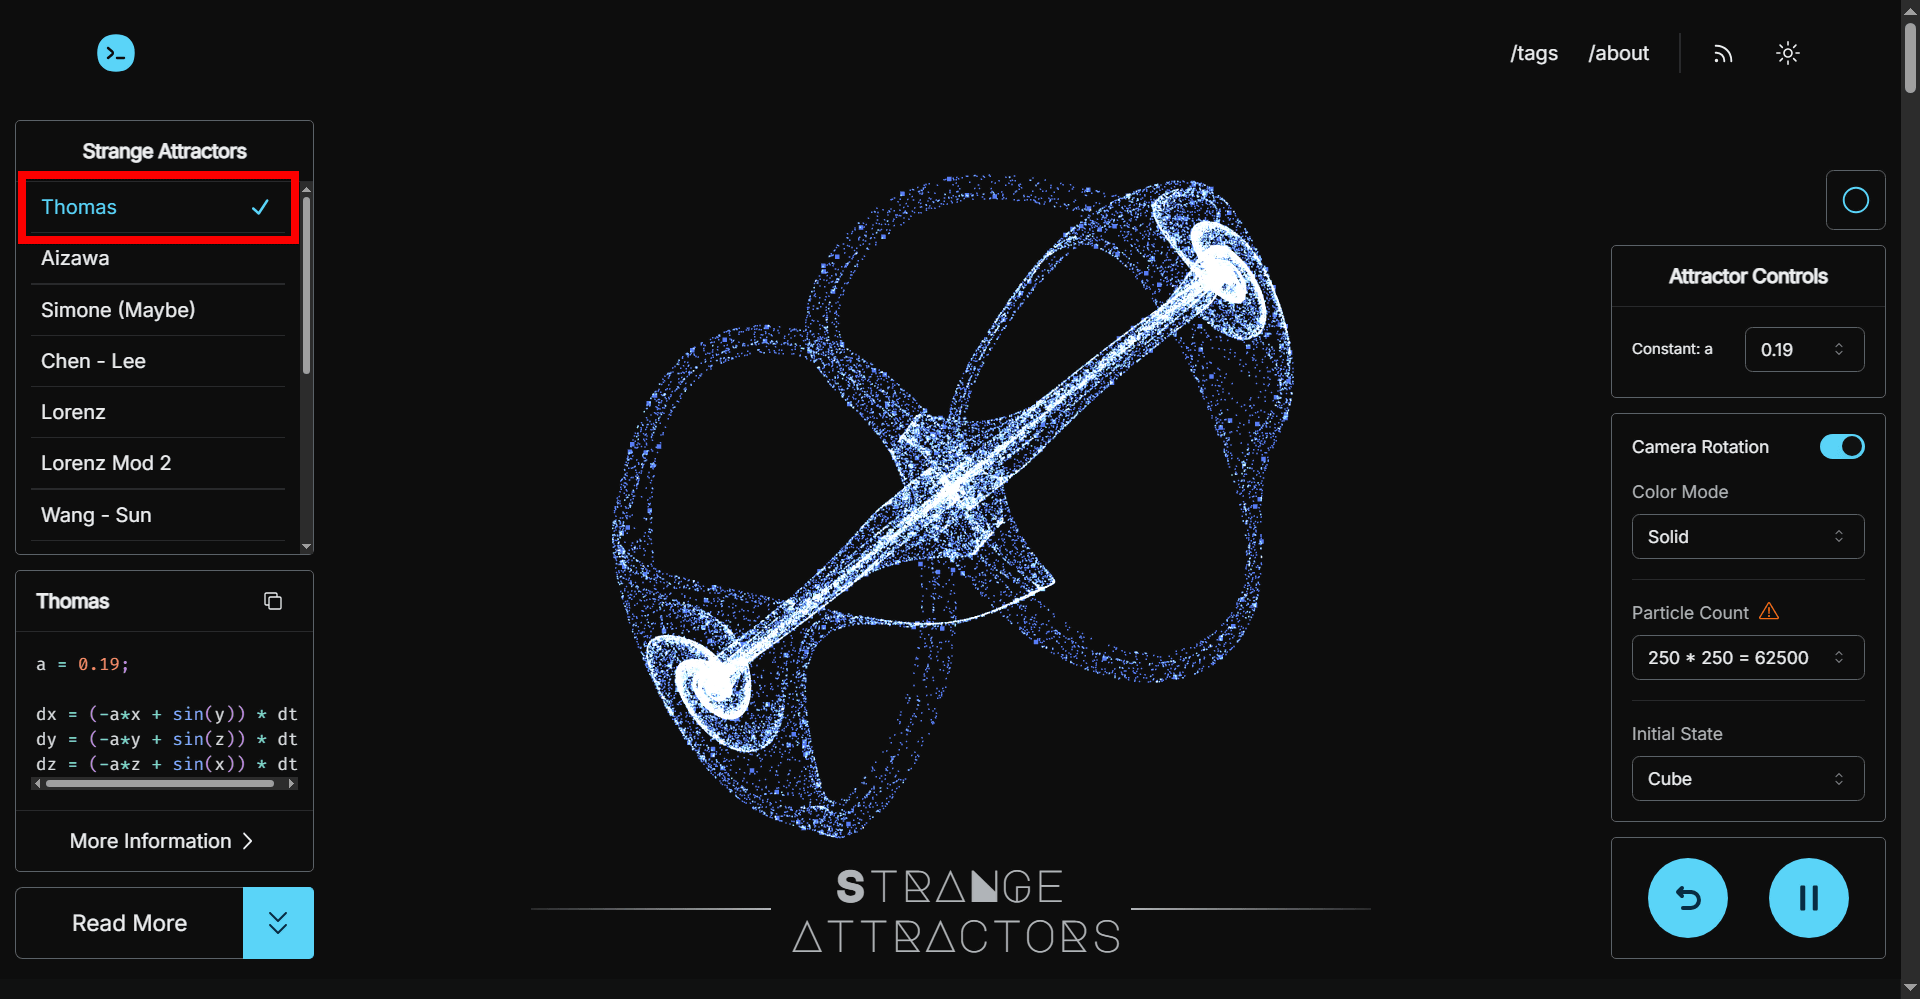
Strange attractors can be selected from the menu on the left.
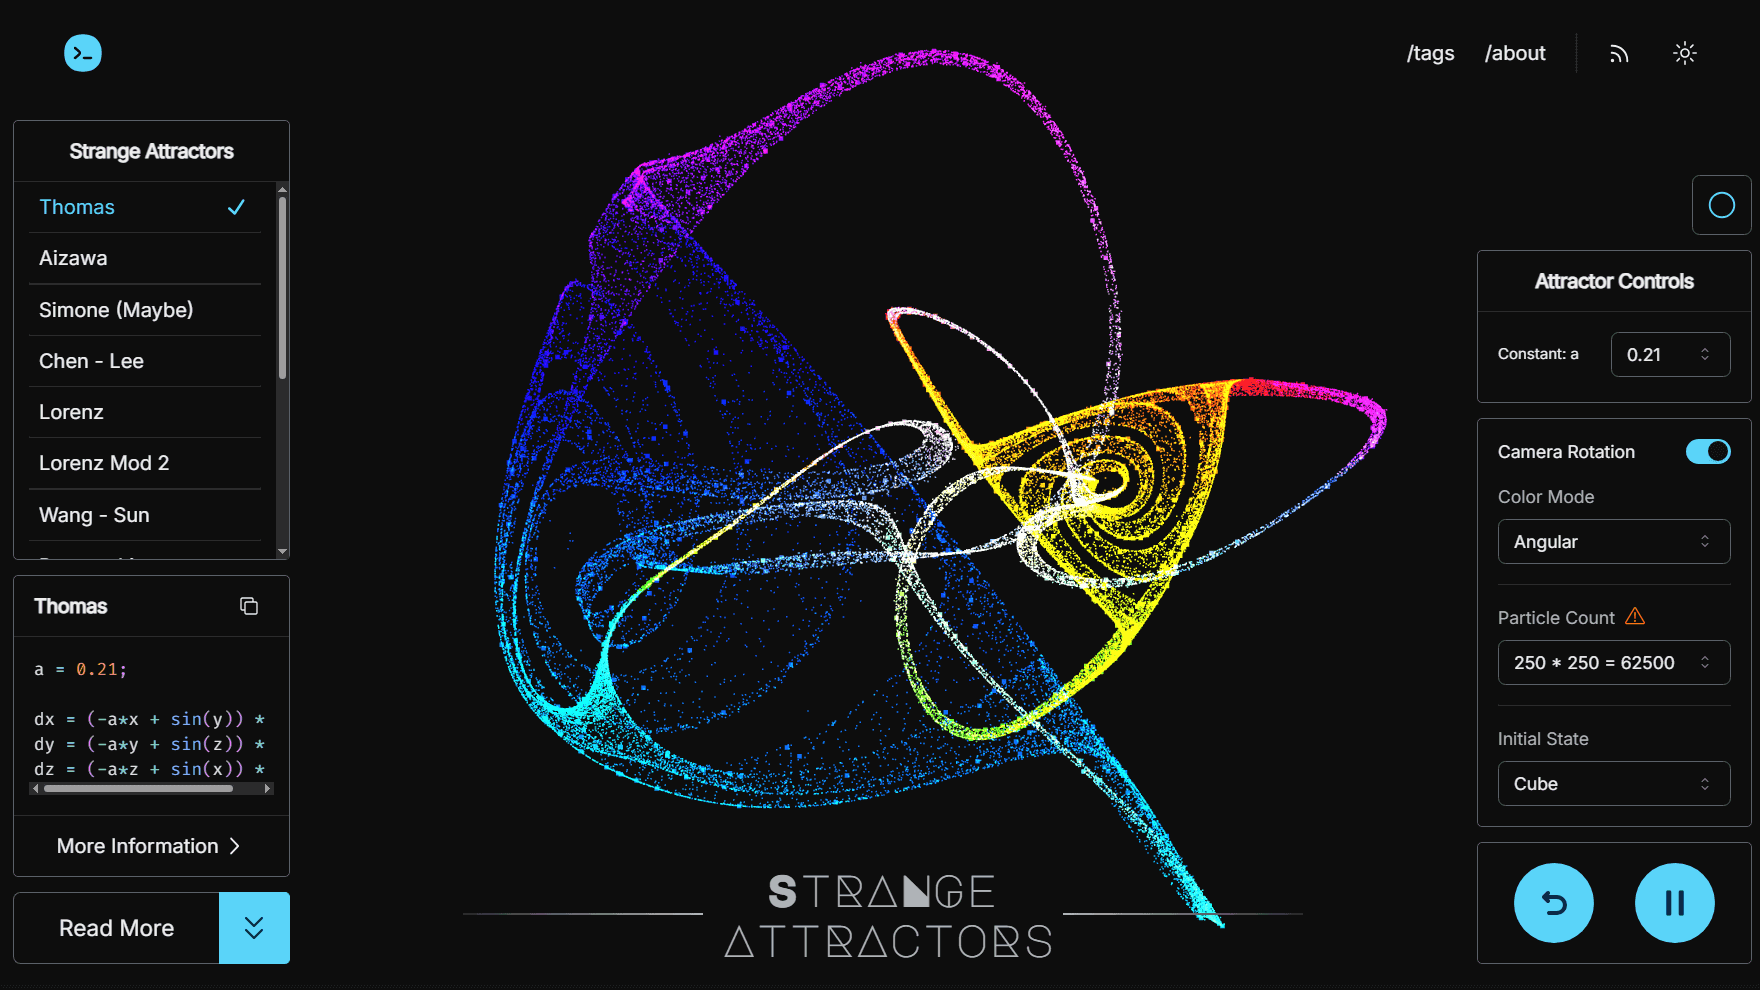
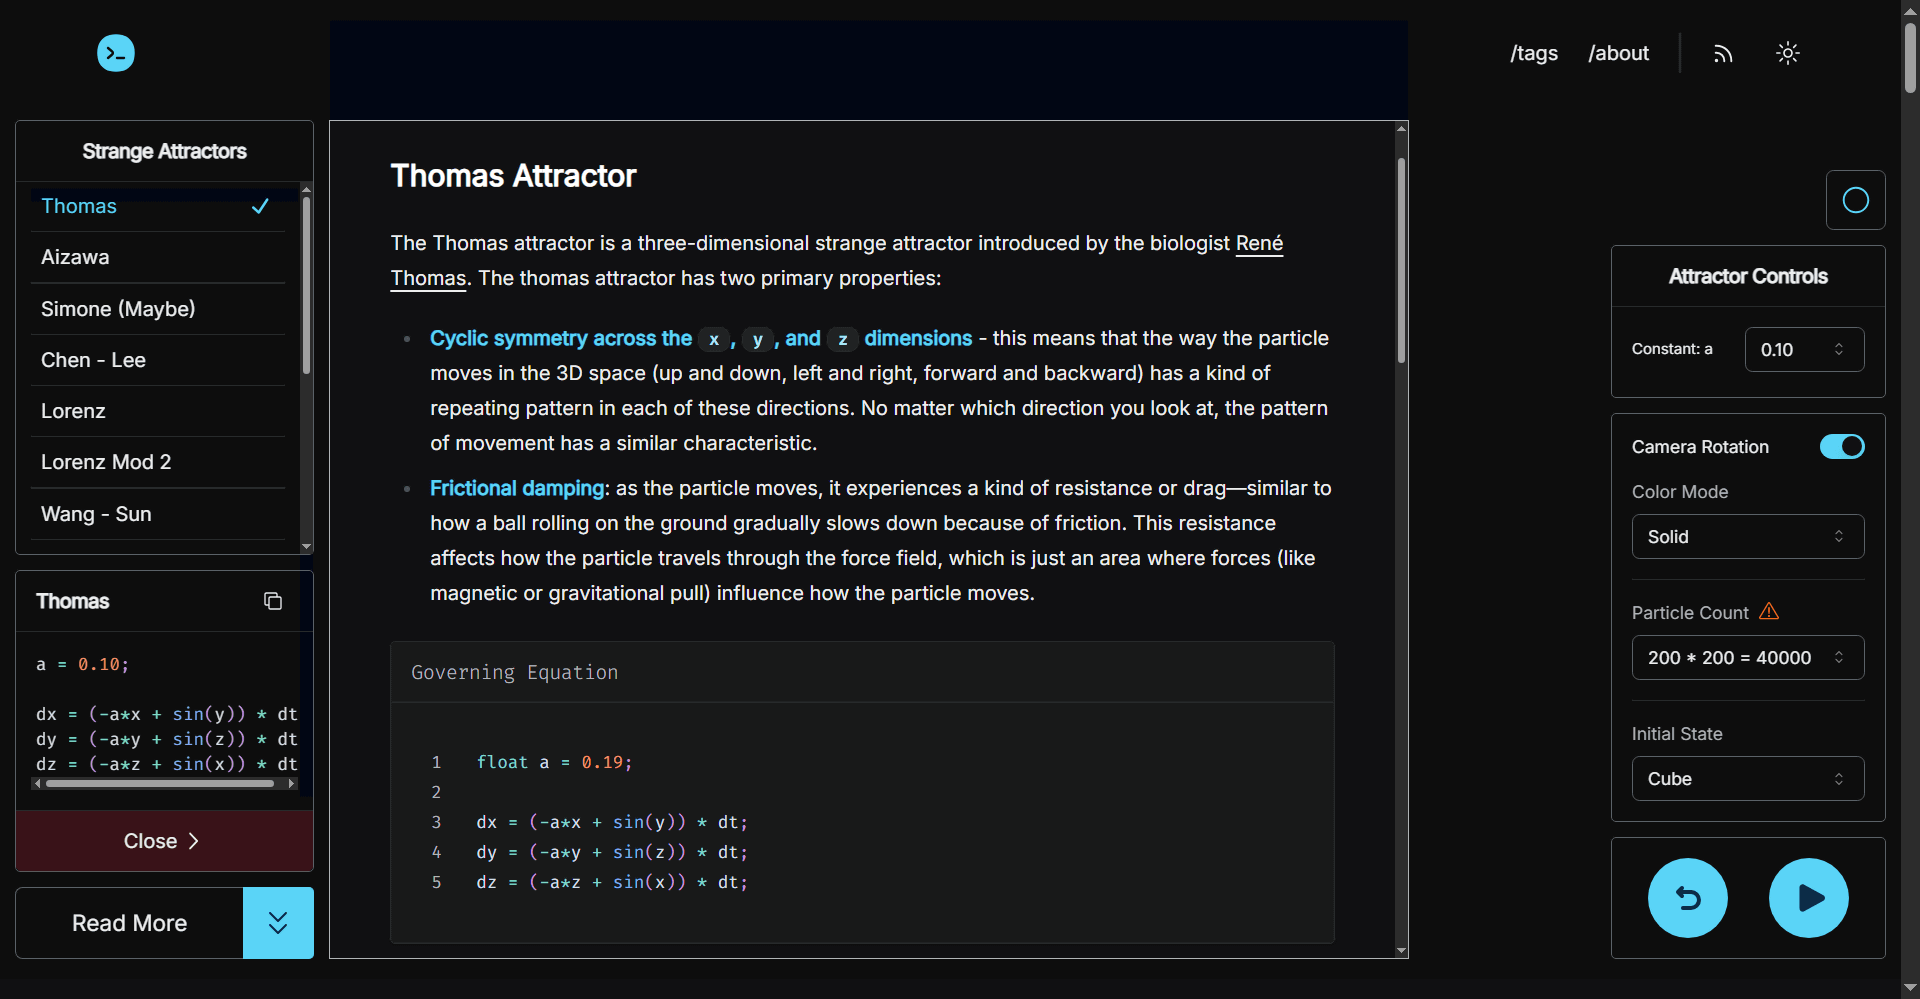
Click 'More information' to see details of the differential equation.
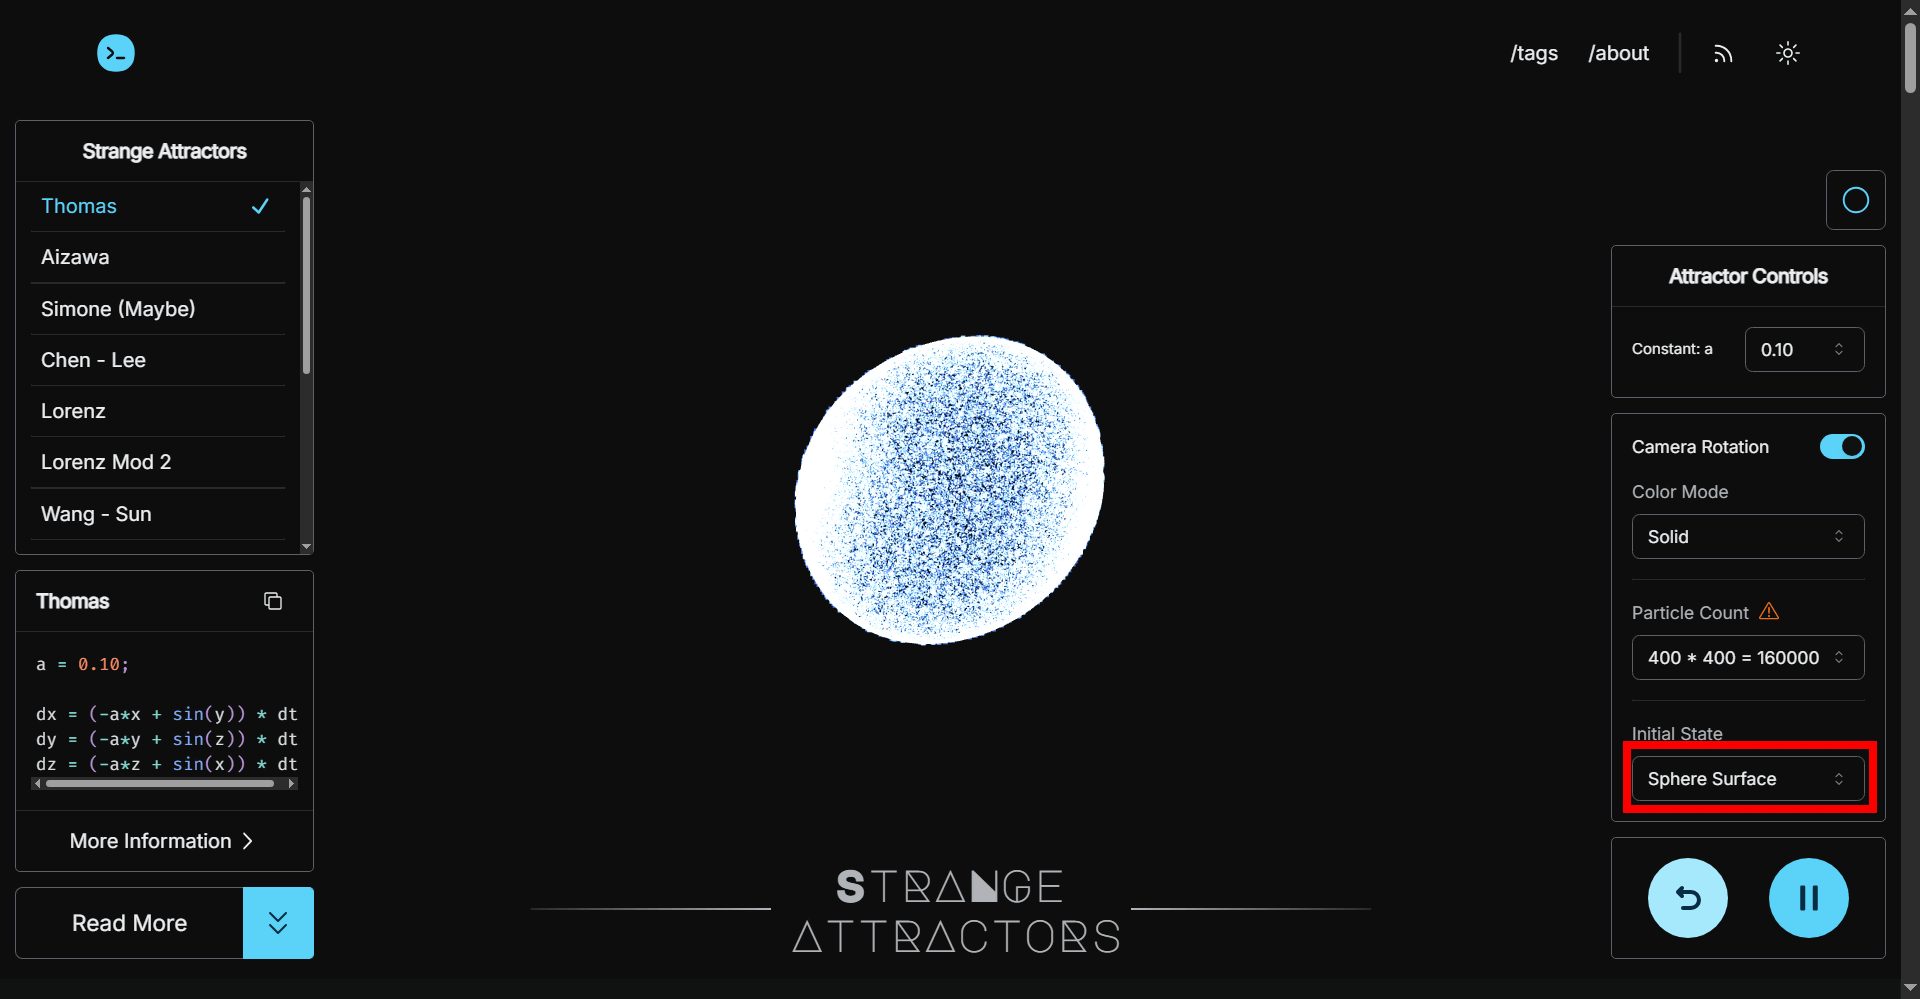
'Thomas' is a strange attractor proposed by Belgian biologist and mathematician René Thomas, and is described by the differential equations 'dx = (-ax + sin(y)) dt', 'dy = (-ax + sin(z)) dt', and 'dz = (-ax + sin(x)) dt'.
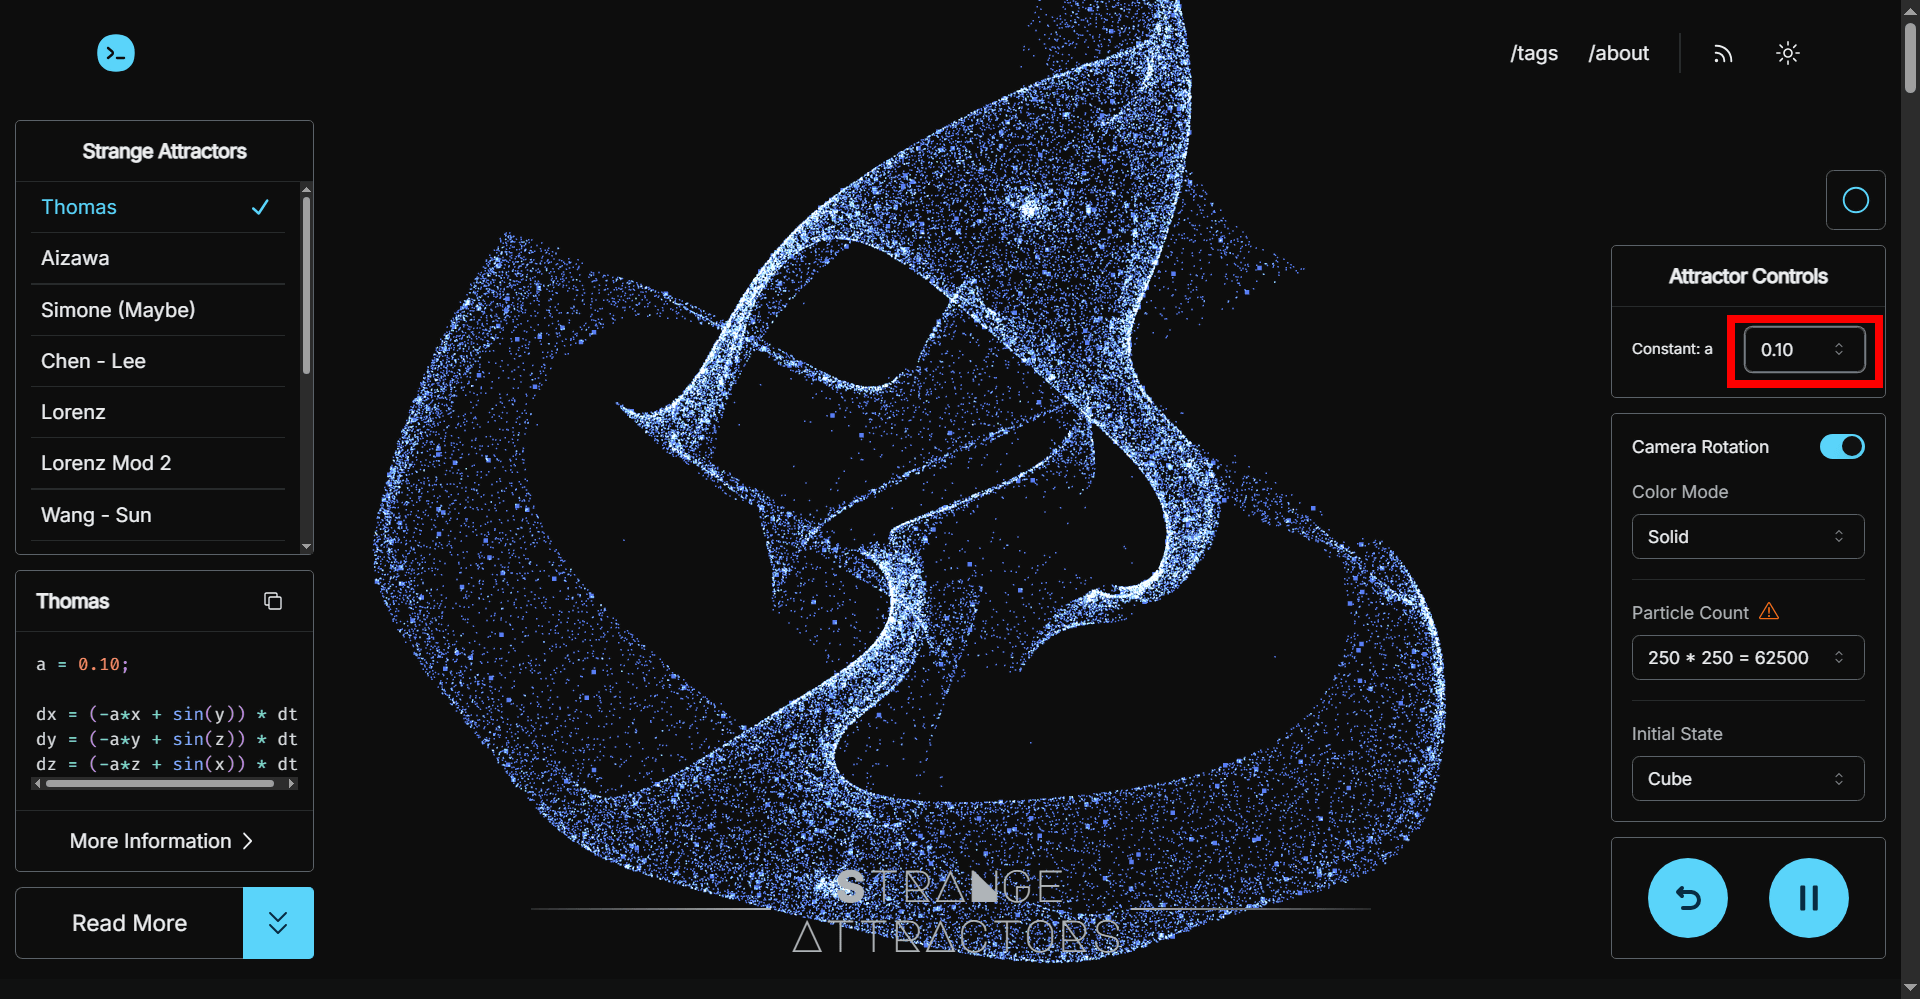
Changing the value of the constant a used in this differential equation changes the shape of the strange attractor. Chaos theory, proposed by American meteorologist
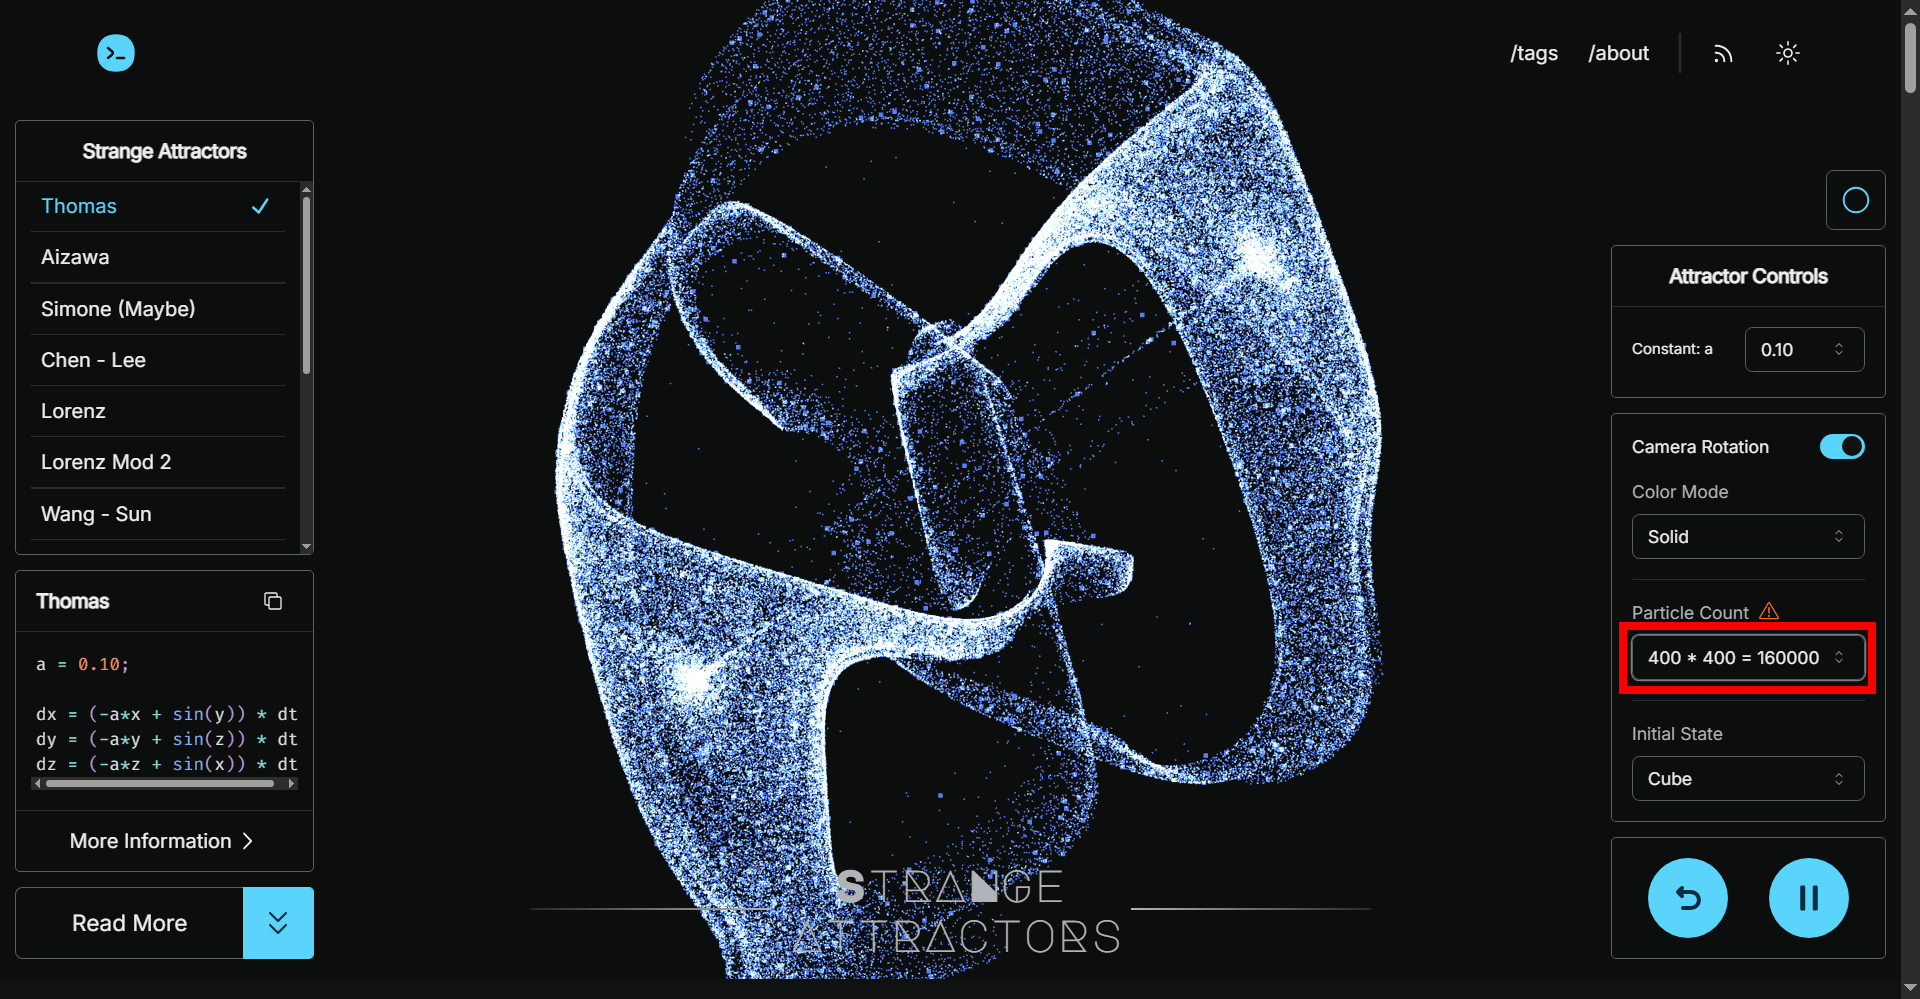
'Particle Count' is the number of dots to be displayed. However, increasing this will increase the amount of calculation required by the CPU and GPU, which may slow down the performance depending on the performance of your PC.
The “Initial State” that determines the initial values of the points can be chosen from two types: “Cube” and “Sphere Surface.” In the case of “Sphere Surface,” the points form the surface of a sphere.
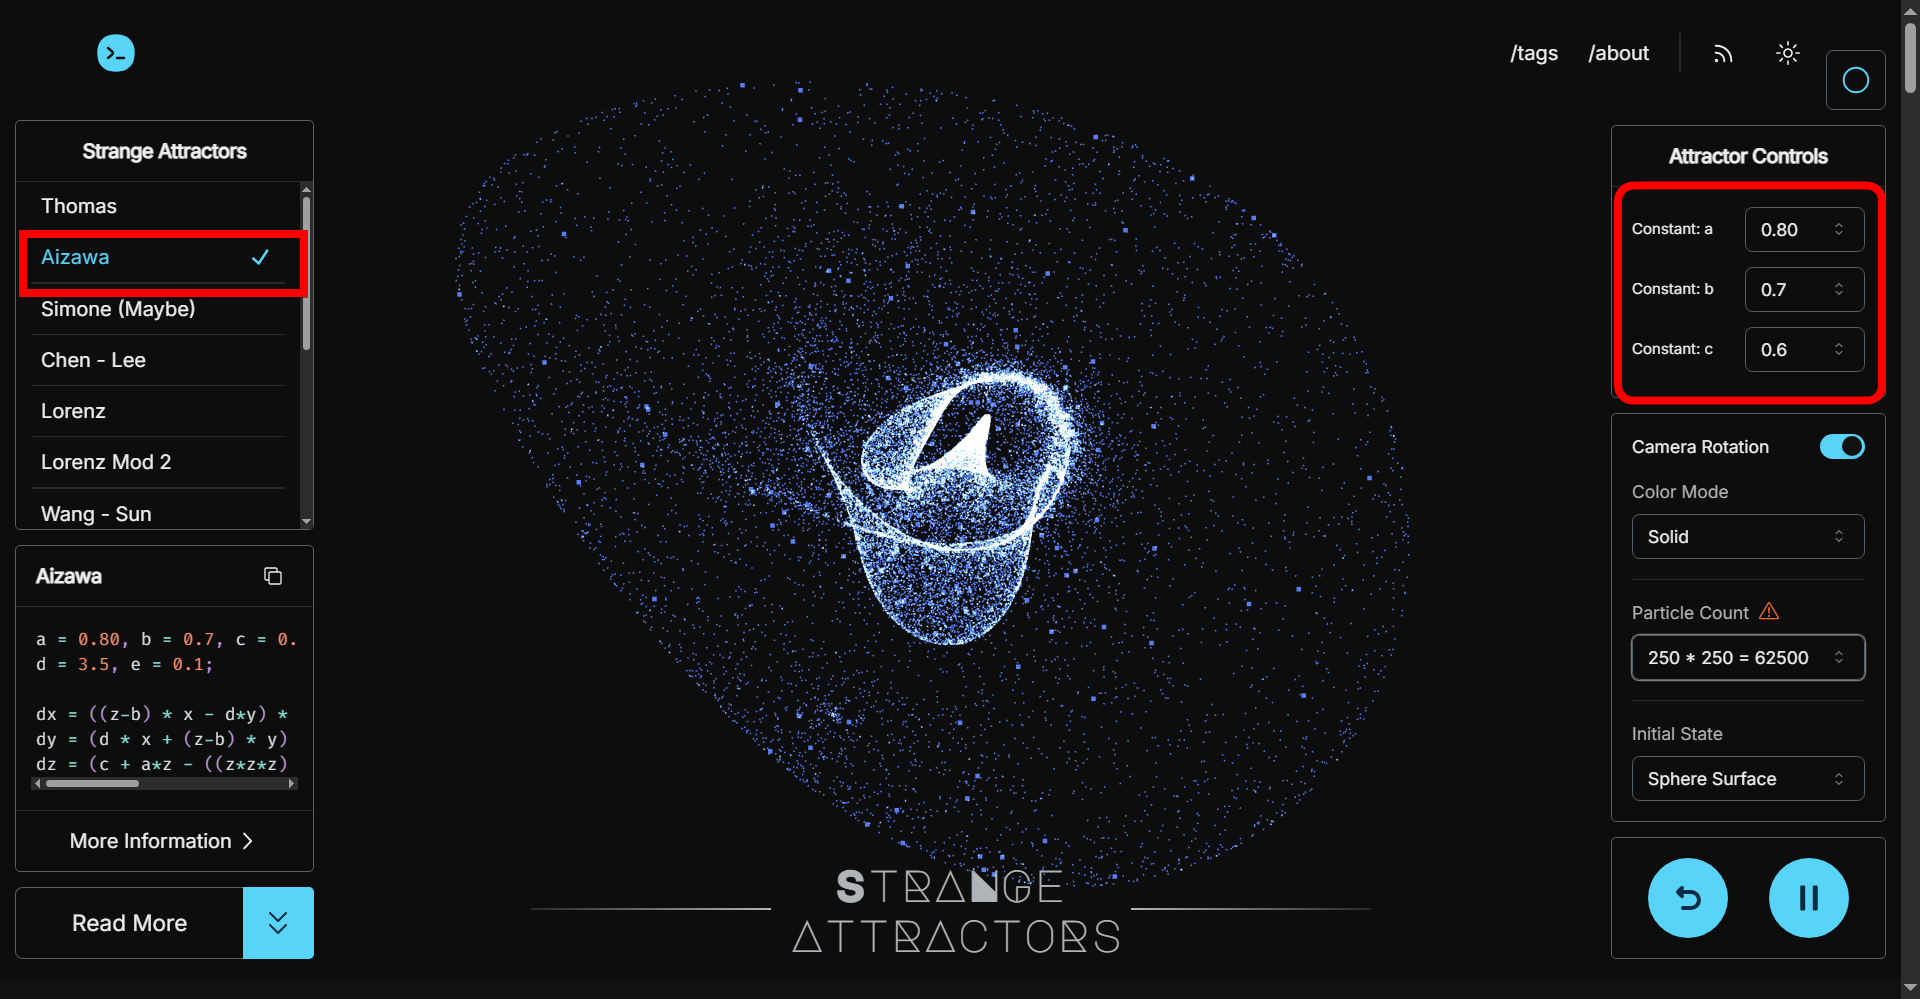
'Aizawa' is an Aizawa attractor, characterized by a vortex-like shape. There are three constants: a, b, and c.
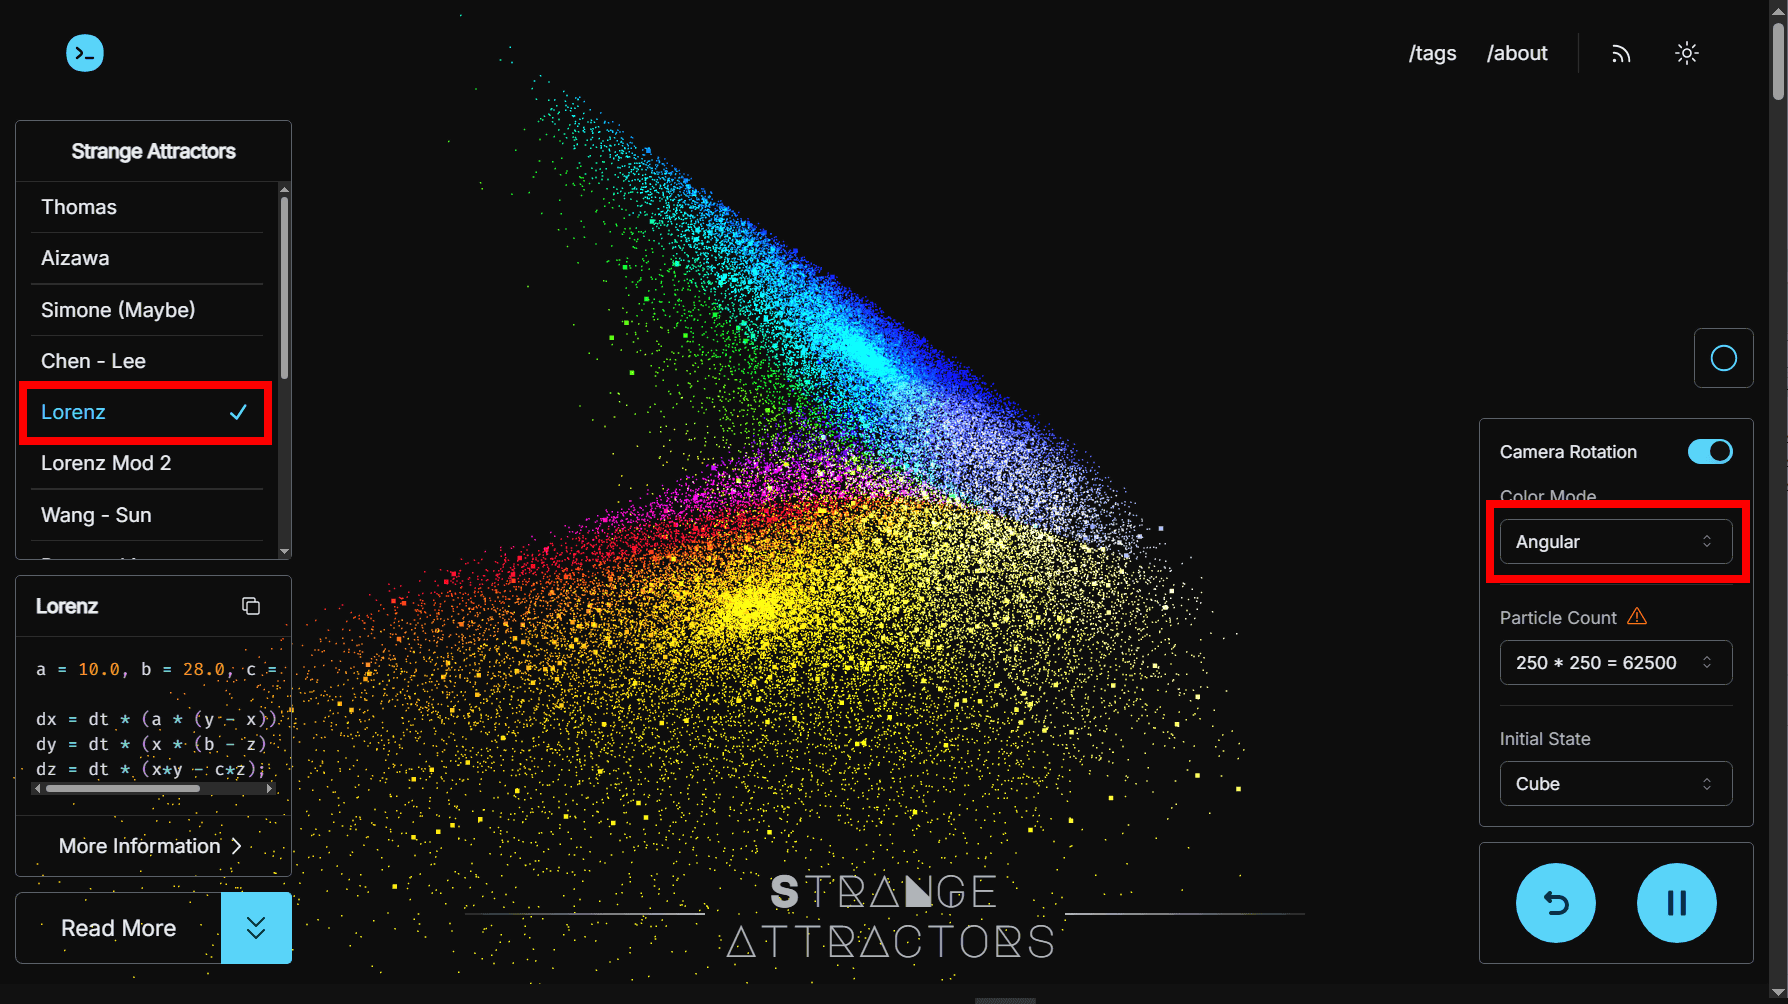
You can color the points with 'Color.' The image below shows
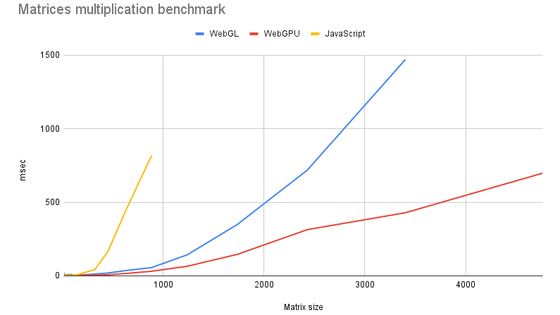
According to developer Tomar, 'Strange Attractors' calculates and draws a huge number of particles in real time to depict the trajectory of the strange attractor. To do this efficiently, a technique called ' ping-pong rendering ' is used.
Normally, the CPU calculates the next position of a particle and sends that data to the GPU to draw it, but when there are millions of particles, this data transfer becomes a bottleneck. In ping-pong rendering, to eliminate data exchange with the CPU, two data storage areas, A and B, are prepared within the GPU. Data from A is read and calculated, and the results are written to B. Next, data from B is read and calculated, and the results are written to A. By rapidly switching the roles of A and B like playing ping-pong, it is apparently possible to process large amounts of particle calculations at high speed.
Related Posts:


in Software, Science, Review, Web Application, Posted by log1i_yk