Which drives are most likely to fail? Backblaze's HDD failure rate report for Q3 2025 released
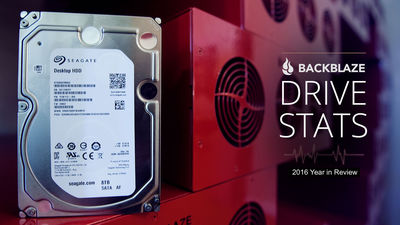
Backblaze Drive Stats for Q3 2025
https://www.backblaze.com/blog/backblaze-drive-stats-for-q3-2025/
The breakdown of HDD failures in the Q3 2025 report is as follows: The report covered 328,348 data drives, of which 1,250 failed, representing a cumulative operating life of 29,431,703 days. By manufacturer, HGST accounted for 8.31% of the failures, followed by Seagate at 34.08%, Toshiba at 33.69%, and Western Digital (WDC) at 23.92%.
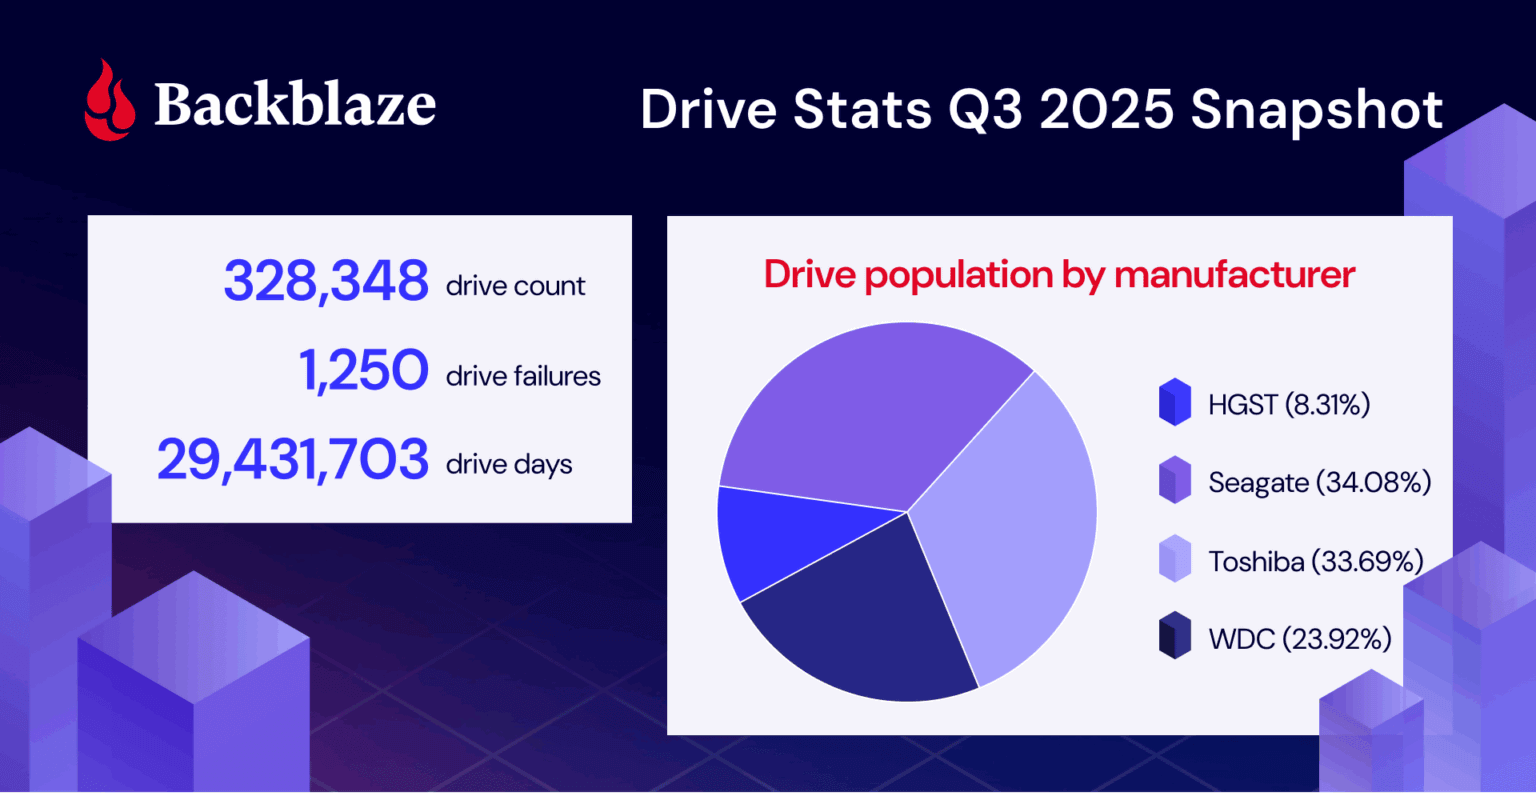
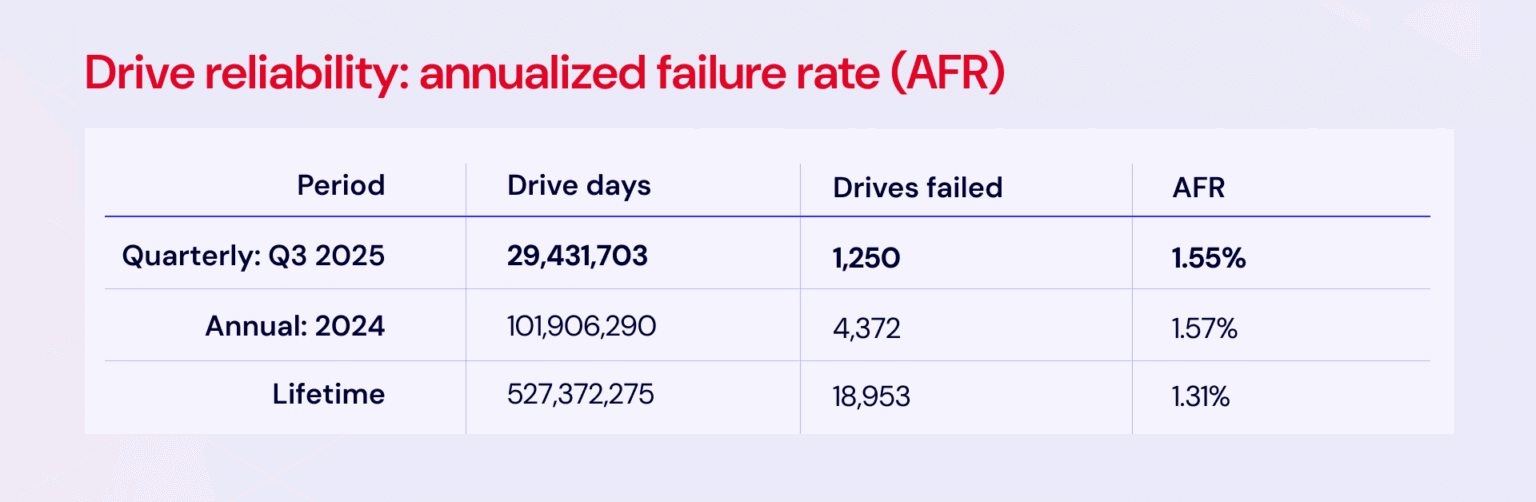
The HDD failure rate (AFR) for the third quarter of 2025 is 1.55%. The AFR for 2024 is 1.57%, and the AFR for all data collected since January 2013, when Backblaze began collecting statistics on HDD failure rates, is 1.31%.
The table below summarizes the AFRs of the 328,348 HDDs operated as data drives in the third quarter of 2025, of which 100 units were in operation as of July 1, 2025, and the cumulative number of operating days exceeded 10,000.
| Manufacturer | Model name | Capacity (TB) | Number of operations | Average operating time (month) | Cumulative number of working days | Number of malfunctions | Failure rate (AFR) |
|---|---|---|---|---|---|---|---|
| HGST | HMS5C4040BLE640 | 4 | 187 | 100.24 | 17194 | 0 | 0% |
| HGST | HUH728080ALE600 | 8 | 1079 | 87.41 | 98985 | 6 | 2.21% |
| HGST | HUH721212ALE600 | 12 | 2615 | 69.57 | 239677 | 9 | 1.37% |
| HGST | HUH721212ALE604 | 12 | 13417 | 50.60 | 1227006 | 65 | 1.93% |
| HGST | HUH721212ALN604 | 12 | 9985 | 74.97 | 912361 | 109 | 4.36% |
| Seagate | ST8000DM002 | 8 | 8987 | 106.89 | 824787 | 27 | 1.19% |
| Seagate | ST8000NM000A | 8 | 247 | 32.05 | 22724 | 0 | 0% |
| Seagate | ST8000NM0055 | 8 | 13351 | 95.55 | 1224440 | 53 | 1.58% |
| Seagate | ST10000NM0086 | 10 | 1018 | 92.35 | 91650 | 20 | 7.97% |
| Seagate | ST12000NM0007 | 12 | 1005 | 69.87 | 91835 | 13 | 5.17% |
| Seagate | ST12000NM0008 | 12 | 18902 | 64.73 | 1728706 | 132 | 2.79% |
| Seagate | ST12000NM000J | 12 | 1019 | 14.12 | 91723 | 2 | 0.80% |
| Seagate | ST12000NM001G | 12 | 13277 | 54.78 | 1219082 | 31 | 0.93% |
| Seagate | ST14000NM000J | 14 | 392 | 11.85 | 31852 | 4 | 4.58% |
| Seagate | ST14000NM001G | 14 | 10596 | 54.28 | 972882 | 38 | 1.42% |
| Seagate | ST14000NM0138 | 14 | 1286 | 56.57 | 117131 | twenty two | 6.86% |
| Seagate | ST16000NM001G | 16 | 34128 | 35.98 | 3125133 | 57 | 0.67% |
| Seagate | ST16000NM002J | 16 | 463 | 33.06 | 42581 | 0 | 0% |
| Seagate | ST24000NM002H | twenty four | 7245 | 5.81 | 601539 | 46 | 2.79% |
| Toshiba | MG07ACA14TA | 14 | 37463 | 58.20 | 3440051 | 116 | 1.23% |
| Toshiba | MG07ACA14TEY | 14 | 970 | 35.12 | 85530 | 8 | 3.41% |
| Toshiba | MG08ACA16TA | 16 | 40184 | 24.83 | 3686376 | 85 | 0.84% |
| Toshiba | MG08ACA16TE | 16 | 6177 | 43.84 | 553332 | 16 | 1.06% |
| Toshiba | MG08ACA16TEY | 16 | 5145 | 44.61 | 462943 | 215 | 16.95% |
| Toshiba | MG09ACA16TE | 16 | 244 | 4.86 | 17852 | 0 | 0% |
| Toshiba | MG10ACA20TE | 20 | 18023 | 7.08 | 1416127 | twenty one | 0.54% |
| Toshiba | MG11ACA24TE | twenty four | 2400 | 0.33 | 24148 | 0 | 0% |
| WDC | WUH721414ALE6L4 | 14 | 8663 | 55.33 | 794781 | 20 | 0.92% |
| WDC | WUH721816ALE6L0 | 16 | 3008 | 44.46 | 274775 | 20 | 2.66% |
| WDC | WUH721816ALE6L4 | 16 | 26601 | 29.05 | 2439009 | 65 | 0.97% |
| WDC | WUH722222ALE6L4 | twenty two | 40271 | 11.84 | 3555491 | 50 | 0.51% |
Of the HDDs in operation in the third quarter of 2025, the four models that did not fail were 'HMS5C4040BLE640,' 'ST8000NM000A,' 'MG09ACA16TE,' and 'MG11ACA24TE.'
On the other hand, the three models with particularly high failure rates were 'ST10000NM0086' (7.97%), 'ST14000NM0138' (6.86%), and 'MG08ACA16TEY' (16.95%).
The table below summarizes the failure rates of HDDs with more than 500 units in operation and a cumulative operating period of more than 100,000 days as of the third quarter of 2025.
| Manufacturer | Model name | Capacity (TB) | Number of operations | Average operating time (month) | Cumulative number of working days | Number of malfunctions | Failure rate (AFR) |
|---|---|---|---|---|---|---|---|
| HGST | HMS5C4040ALE640 | 4 | 8723 | 63.3 | 16789193 | 260 | 0.57% |
| HGST | HMS5C4040BLE640 | 4 | 16349 | 82.8 | 41156102 | 448 | 0.40% |
| HGST | HUH728080ALE600 | 8 | 1218 | 82.8 | 3069331 | 98 | 1.17% |
| HGST | HUH721212ALE600 | 12 | 2696 | 68.8 | 5641318 | 92 | 0.60% |
| HGST | HUH721212ALE604 | 12 | 14331 | 49.6 | 21613689 | 943 | 1.59% |
| HGST | HUH721212ALN604 | 12 | 11438 | 72.3 | 25143580 | 1507 | 2.19% |
| Seagate | ST8000NM002 | 8 | 10320 | 100.9 | 31658329 | 1317 | 1.52% |
| Seagate | ST8000NM0055 | 8 | 15680 | 89.6 | 42736967 | 2309 | 1.97% |
| Seagate | ST10000NM0086 | 10 | 1304 | 85.5 | 3389398 | 282 | 3.04% |
| Seagate | ST12000NM0007 | 12 | 38843 | 31.4 | 37147796 | 2277 | 2.24% |
| Seagate | ST12000NM0008 | 12 | 21037 | 61.9 | 39632553 | 2225 | 2.05% |
| Seagate | ST12000NM000J | 12 | 1043 | 13.9 | 439834 | 20 | 1.66% |
| Seagate | ST12000NM001G | 12 | 13875 | 53.8 | 22706268 | 615 | 0.99% |
| Seagate | ST14000NM001G | 14 | 11268 | 52.8 | 18113014 | 701 | 1.41% |
| Seagate | ST14000NM0138 | 14 | 1690 | 49.4 | 2540557 | 413 | 5.93% |
| Seagate | ST16000NM001G | 16 | 34936 | 35.6 | 37817926 | 741 | 0.72% |
| Seagate | ST24000NM002H | twenty four | 7281 | 5.8 | 1282596 | 81 | 2.31% |
| Toshiba | MG07ACA14TA | 14 | 39387 | 57 | 68245826 | 1,944 | 1.04% |
| Toshiba | MG07ACA14TEY | 14 | 1015 | 34.2 | 1057345 | 47 | 1.62% |
| Toshiba | MG08ACA16TA | 16 | 41044 | 24.6 | 30687263 | 943 | 1.12% |
| Toshiba | MG08ACA16TE | 16 | 6459 | 42.9 | 8422214 | 295 | 1.28% |
| Toshiba | MG08ACA16TEY | 16 | 5349 | 44 | 7151157 | 442 | 2.26% |
| Toshiba | MG10ACA20TE | 20 | 18069 | 7.1 | 3885513 | 67 | 0.63% |
| WDC | WUH721414ALE6L4 | 14 | 8859 | 54.8 | 14772985 | 218 | 0.52% |
| WDC | WUH721816ALE6L0 | 16 | 3078 | 44.2 | 4123025 | 98 | 0.87% |
| WDC | WUH721816ALE6L4 | 16 | 26870 | 28.9 | 23614641 | 285 | 0.44% |
| WDC | WUH722222ALE6L4 | twenty two | 40521 | 11.8 | 14533863 | 293 | 0.74% |
The overall average AFR was 1.31%, with higher AFRs recorded by 'HUH721212ALE604' (1.59%), 'HUH721212ALN604' (2.19%), 'ST8000NM002' (1.52%), 'ST8000NM0055' (1.97%), 'ST10000NM0086' (3.04%), and 'ST12000NM0007' (2.2%). The 13 models were: 'ST12000NM0008' (2.05%), 'ST12000NM000J' (1.66%), 'ST14000NM001G' (1.41%), 'ST14000NM0138' (5.93%), 'ST24000NM002H' (2.31%), 'MG07ACA14TEY' (1.62%), and 'MG08ACA16TEY' (2.26%).
Related Posts:
in Hardware, Posted by logu_ii