Summary of how to use the iOS version of the benchmark application 'Antutu Benchmark' that can quantify and measure the overall performance of smartphones such as CPU, GPU, memory, and user experience
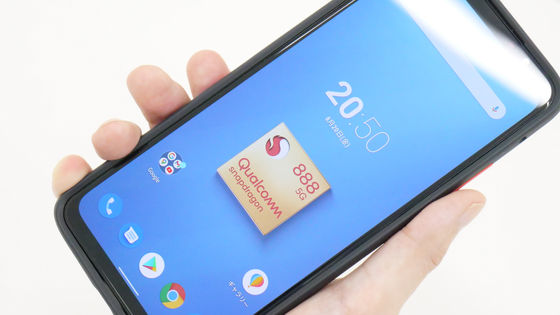
To know the performance of a smartphone, you need to measure it using a benchmark app. The Chinese benchmark app ' Antutu Benchmark ' is a benchmark app that can measure the overall performance of a smartphone, including not only the CPU and GPU but also the user experience. GIGAZINE also uses Antutu Benchmark when reviewing smartphones. Here is a guide on how to use it.
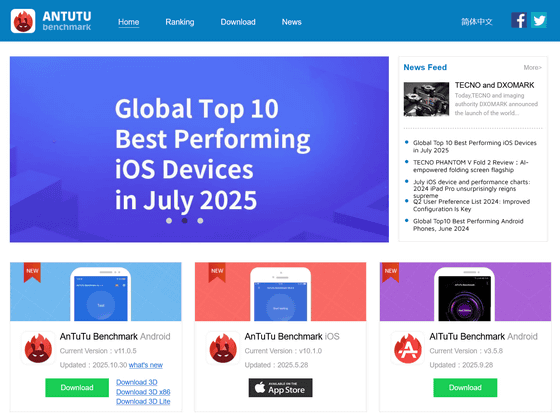
AnTuTu Benchmark - Know Your Android Better
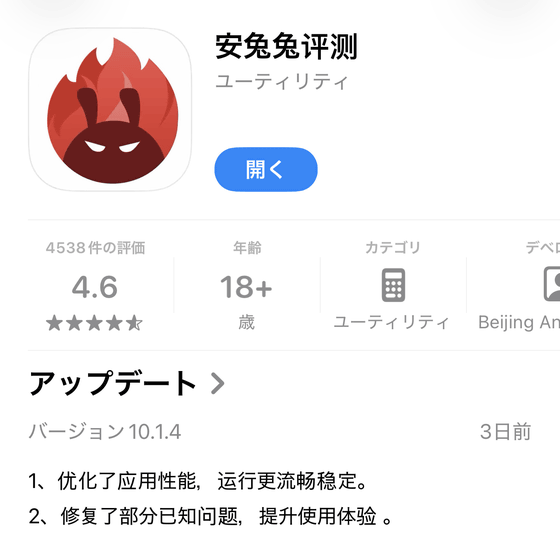
``安兔兔评测'' on the App Store
https://apps.apple.com/jp/app/id803837129
Antutu Benchmark is available for Android, iOS, Windows, and Linux. There are three versions for Android and two for Windows, including one for Arm. However, the Android version is not available on the Google Play Store and must be installed separately using the APK file available on the official website . This time, I installed and used the iOS version on an iPhone 17 Pro .
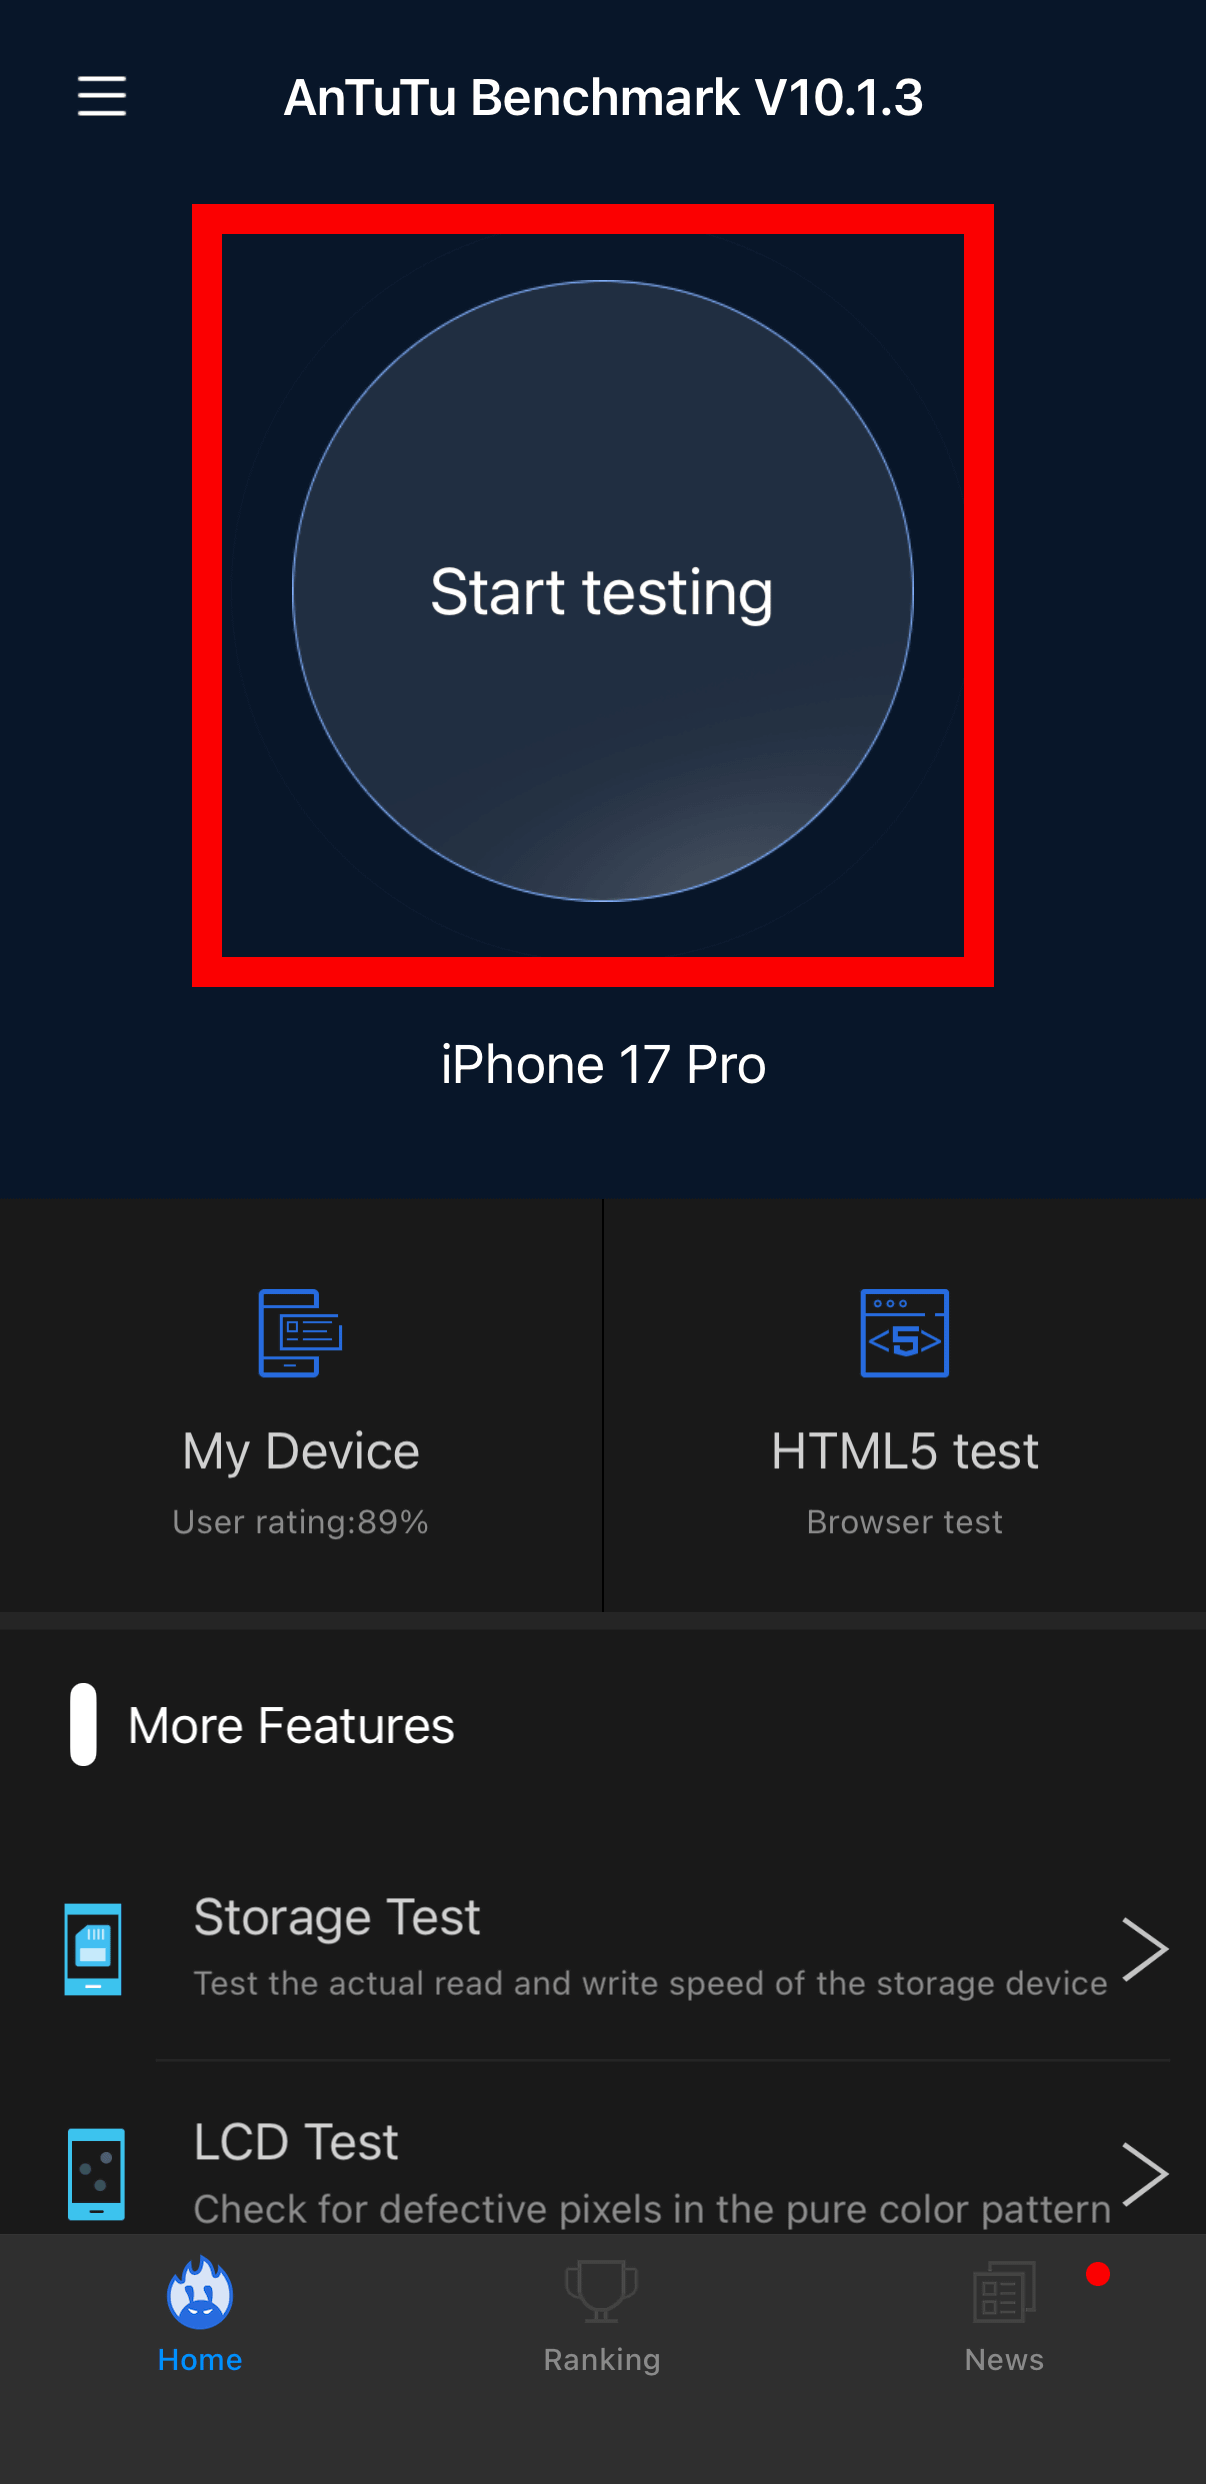
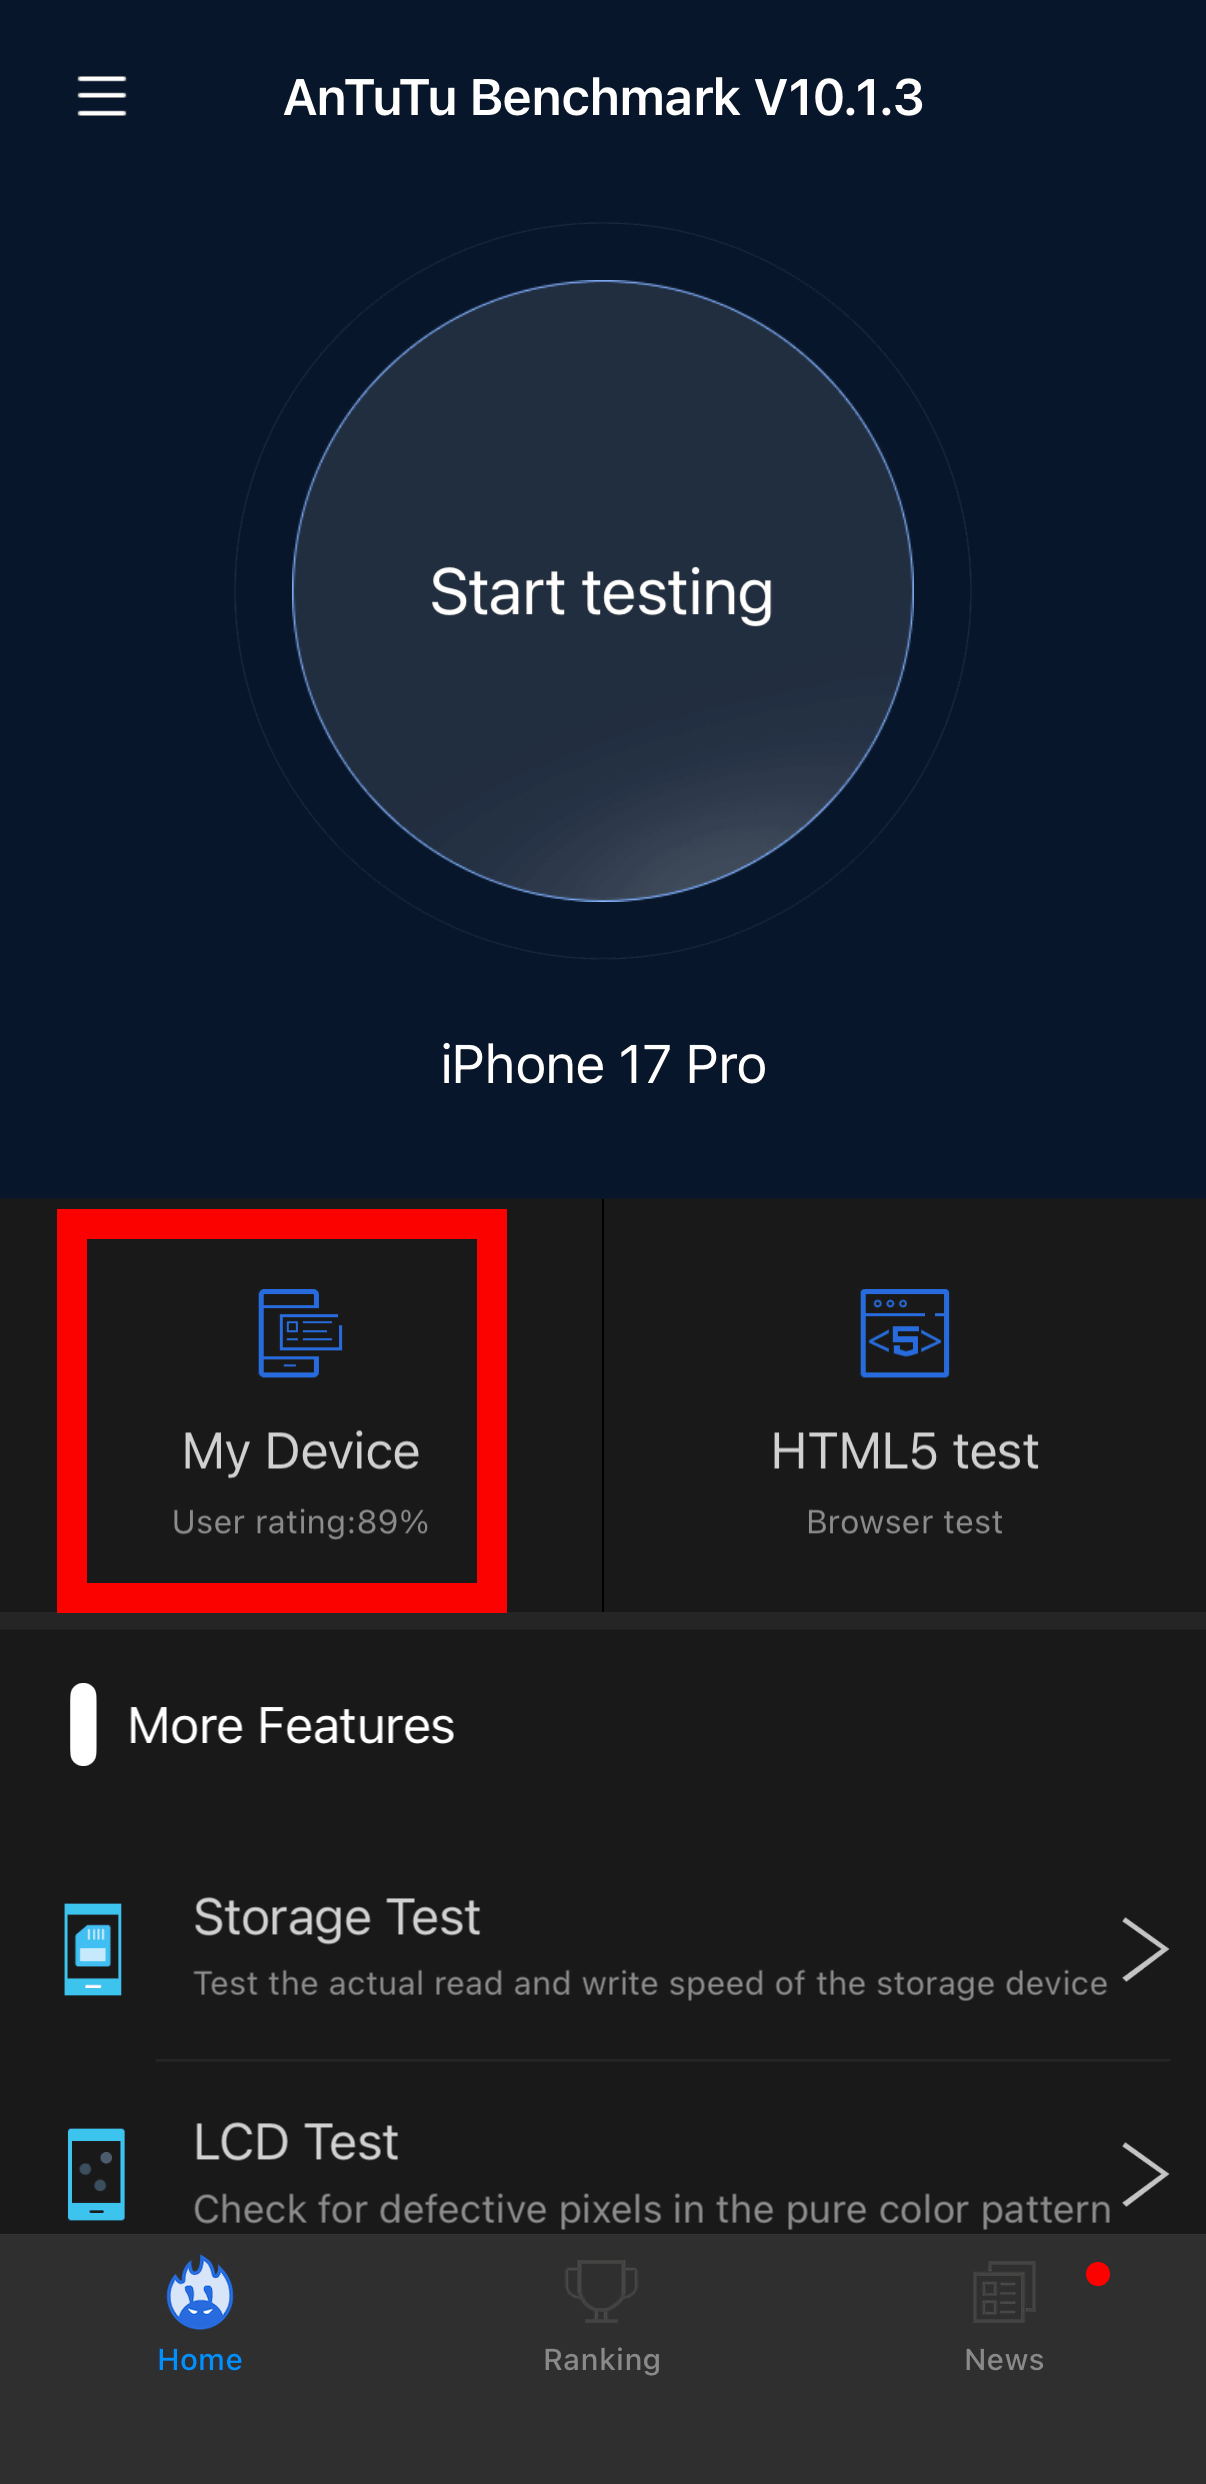
When you launch Antutu Benchmark, it looks like this. Tap the large 'Start testing' button to begin the benchmark.
The benchmark is divided into four stages: First, the GPU stage checks the rendering performance of 3D graphics used in games and other applications.
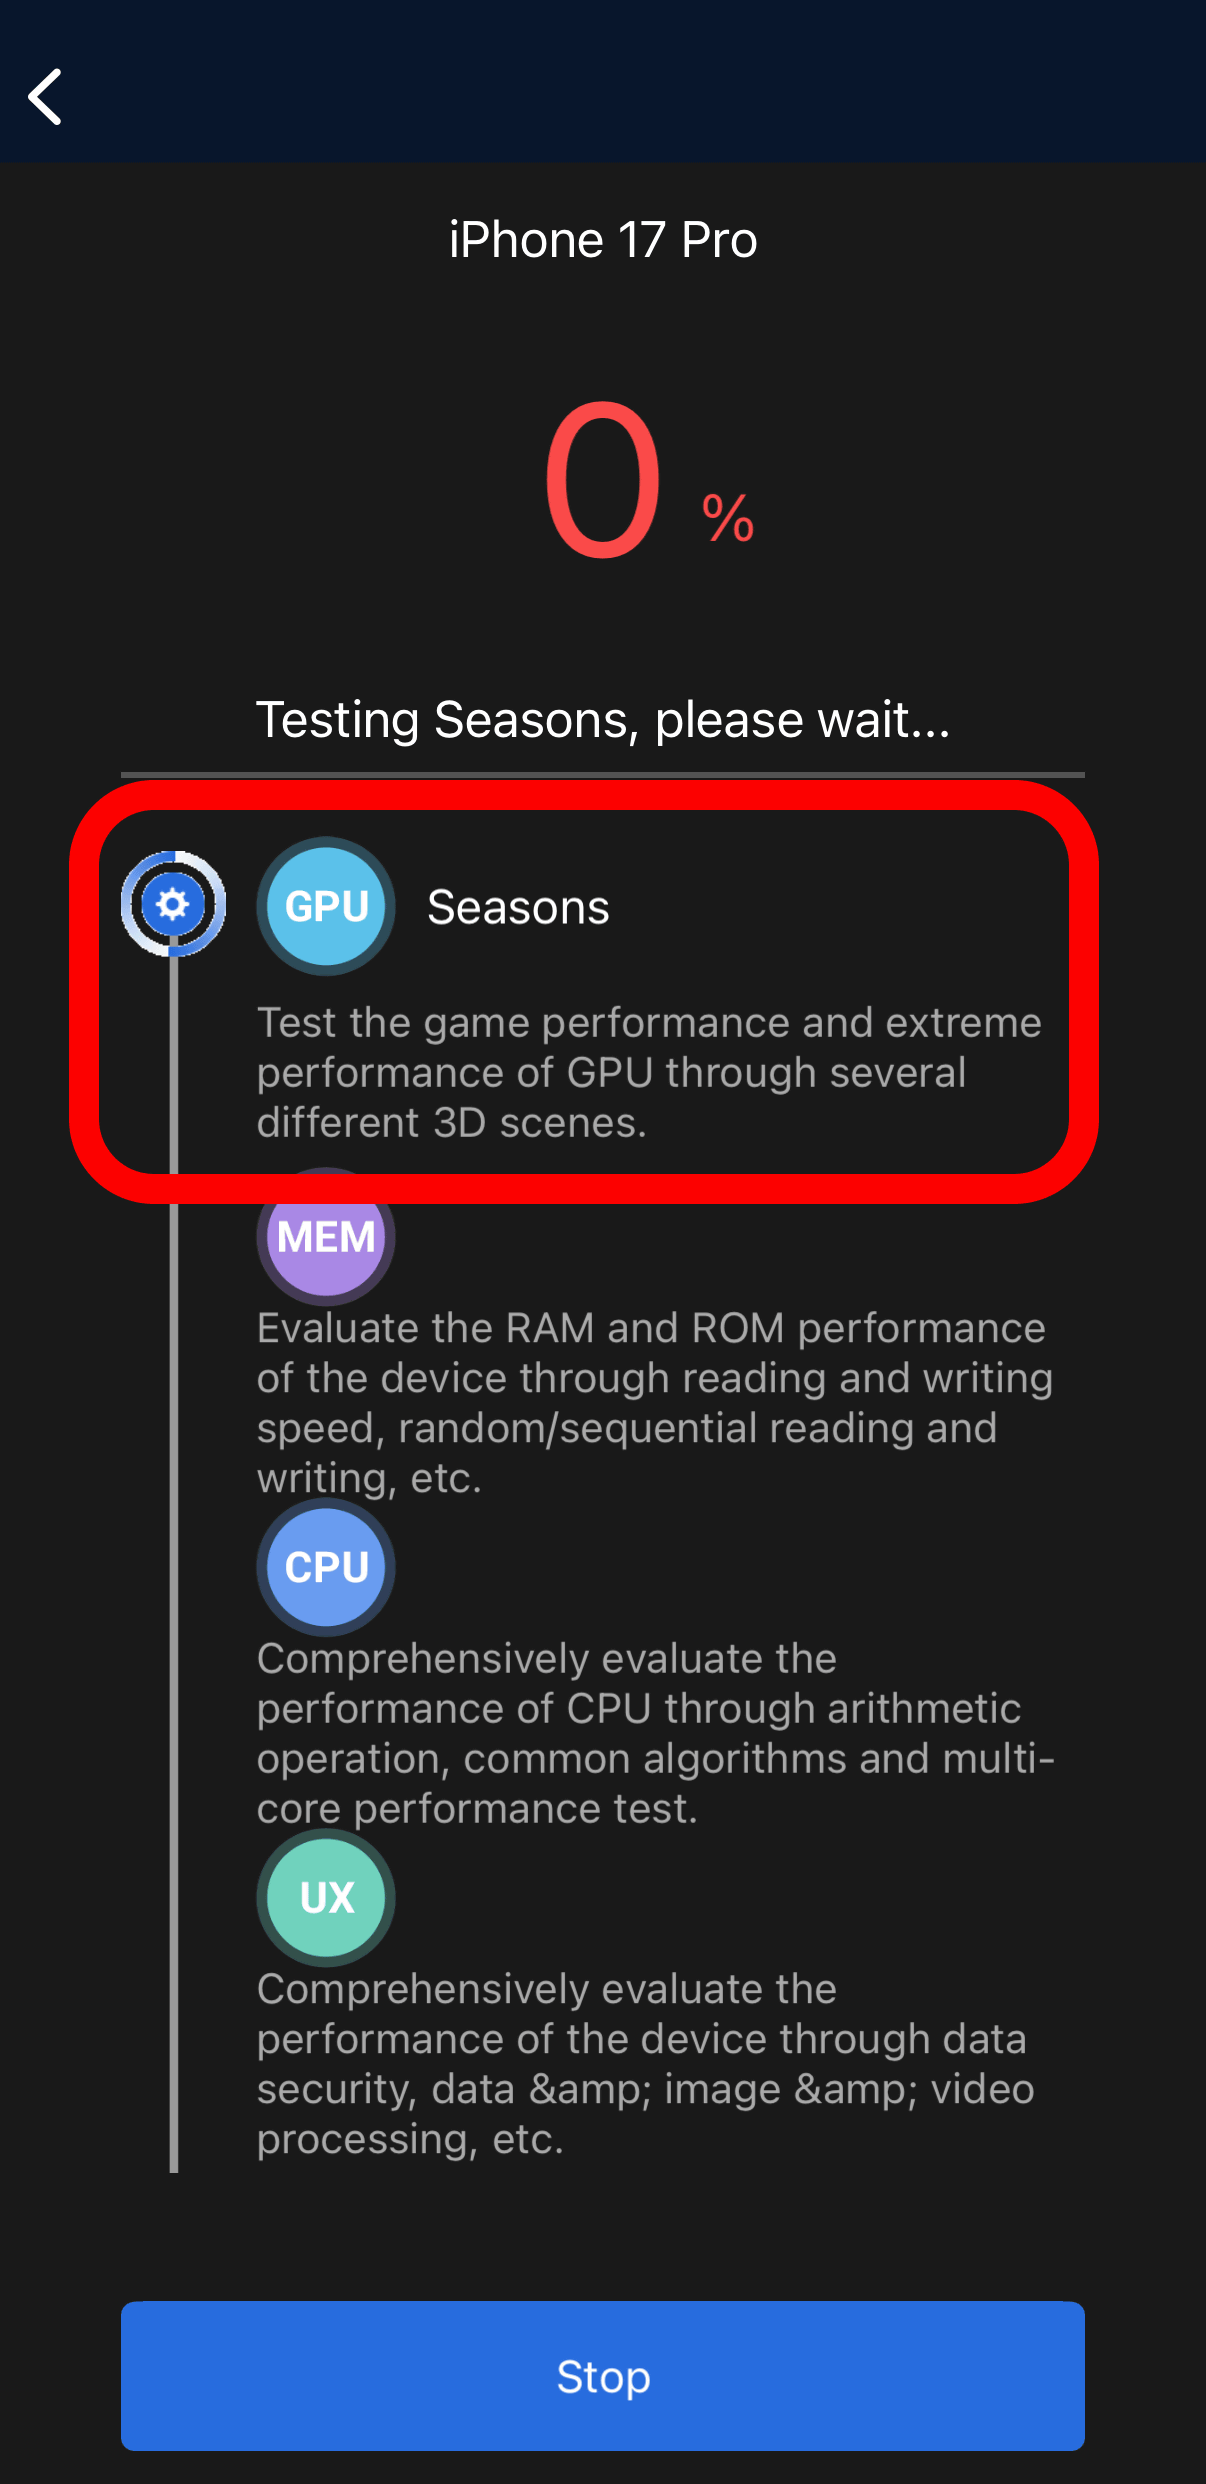
The API is Vulkan , and two types of movies are rendered:

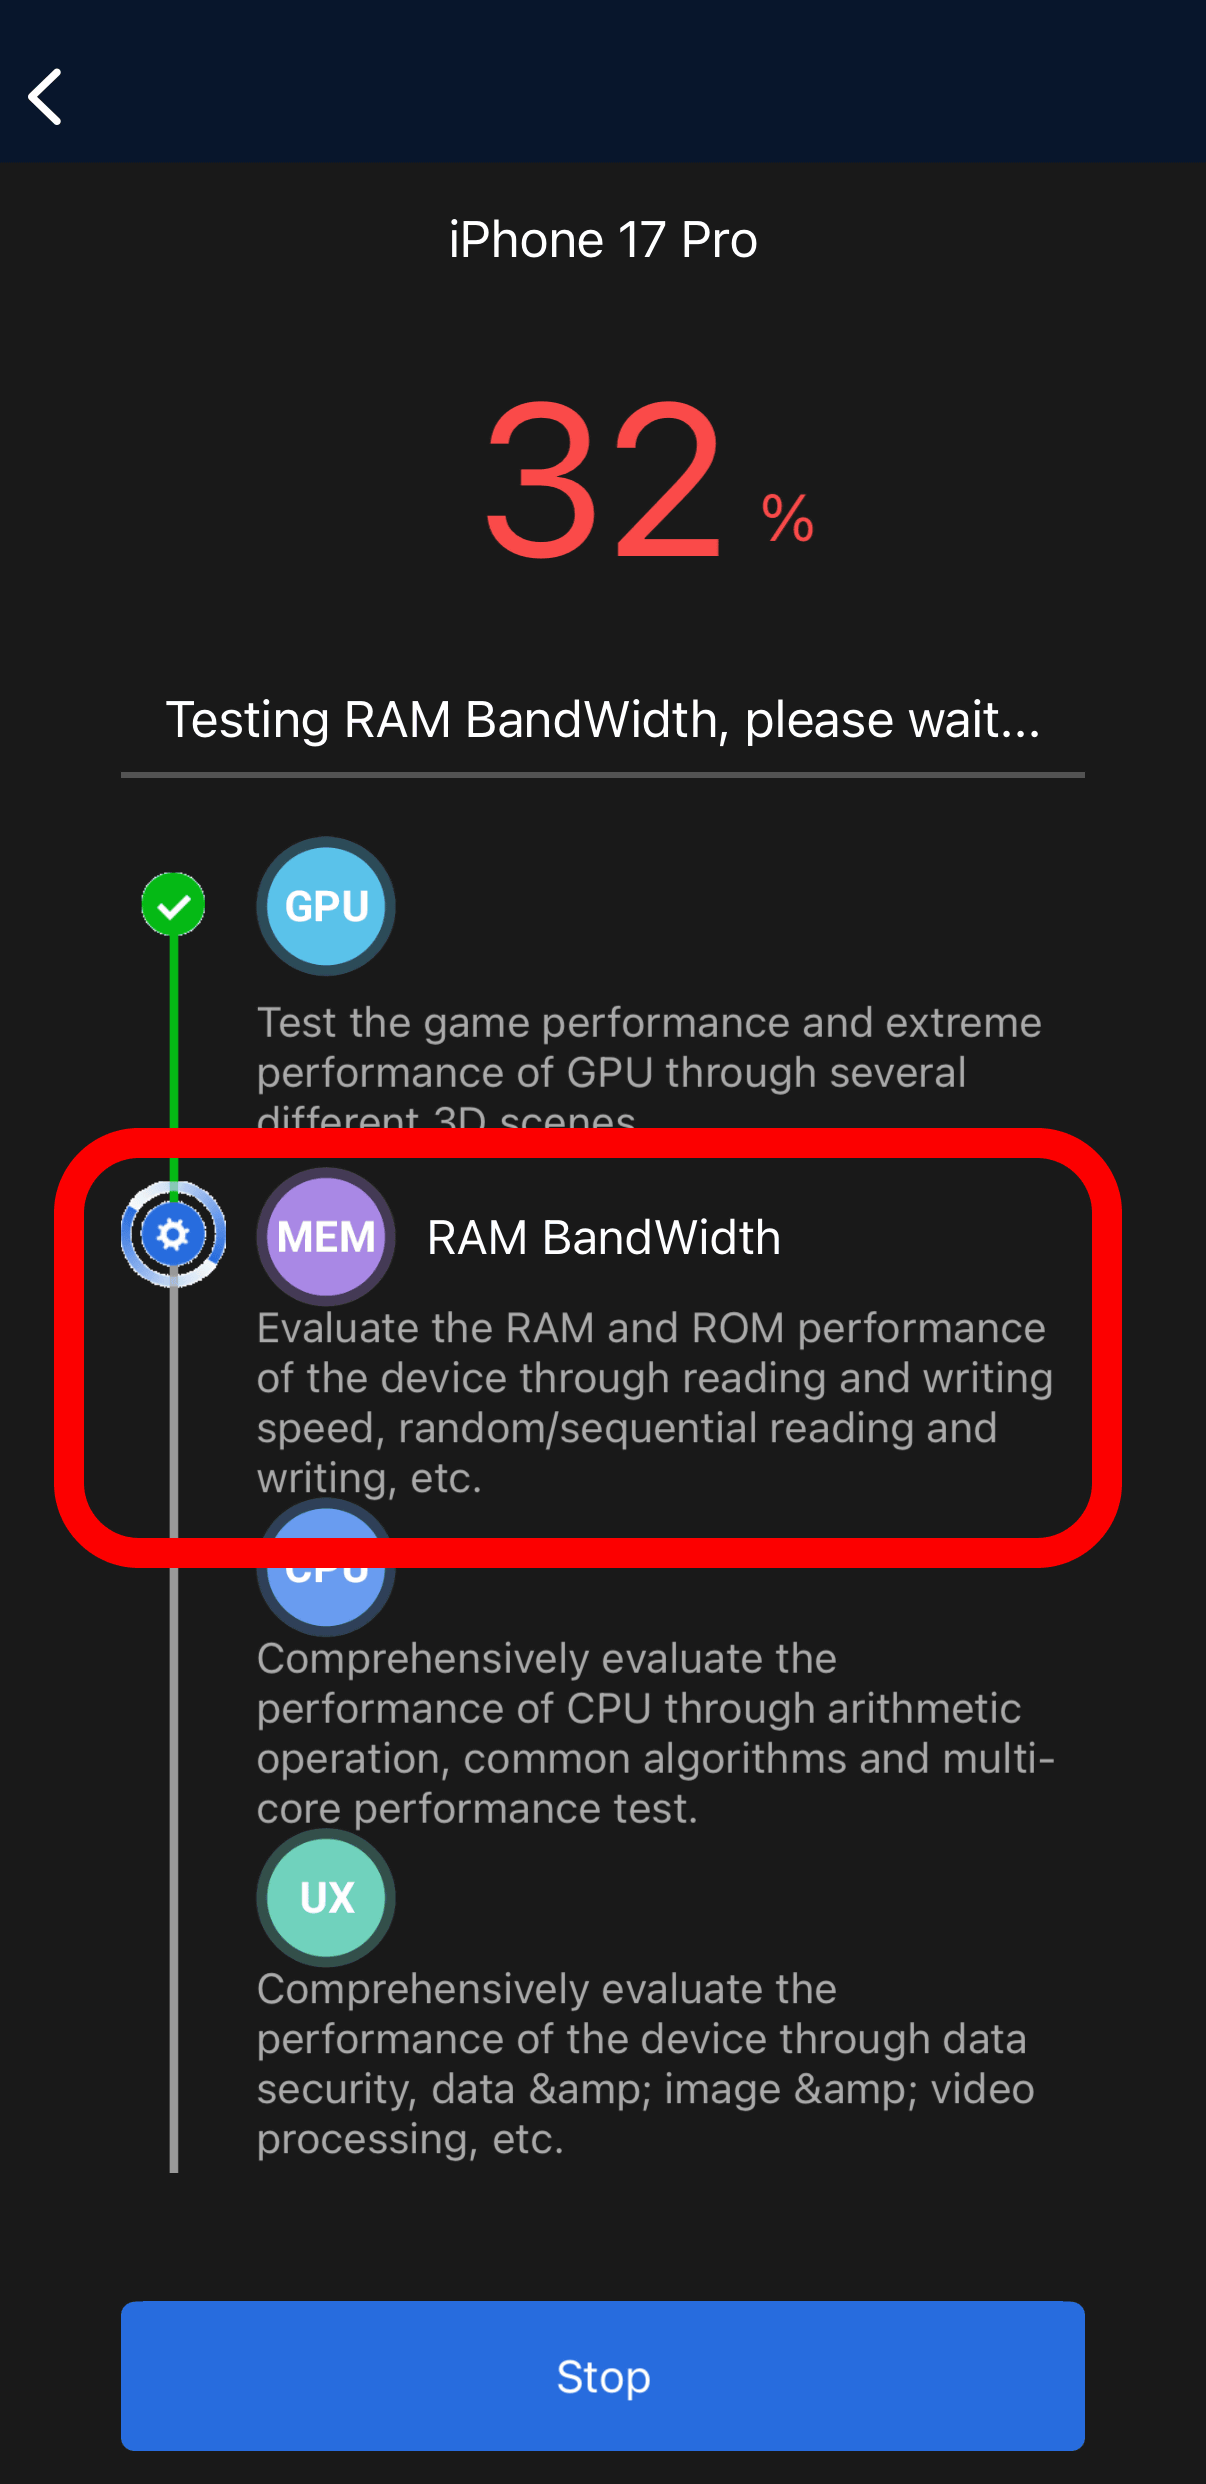
Next, we look at RAM bandwidth, which measures sequential read/write and random access speeds.
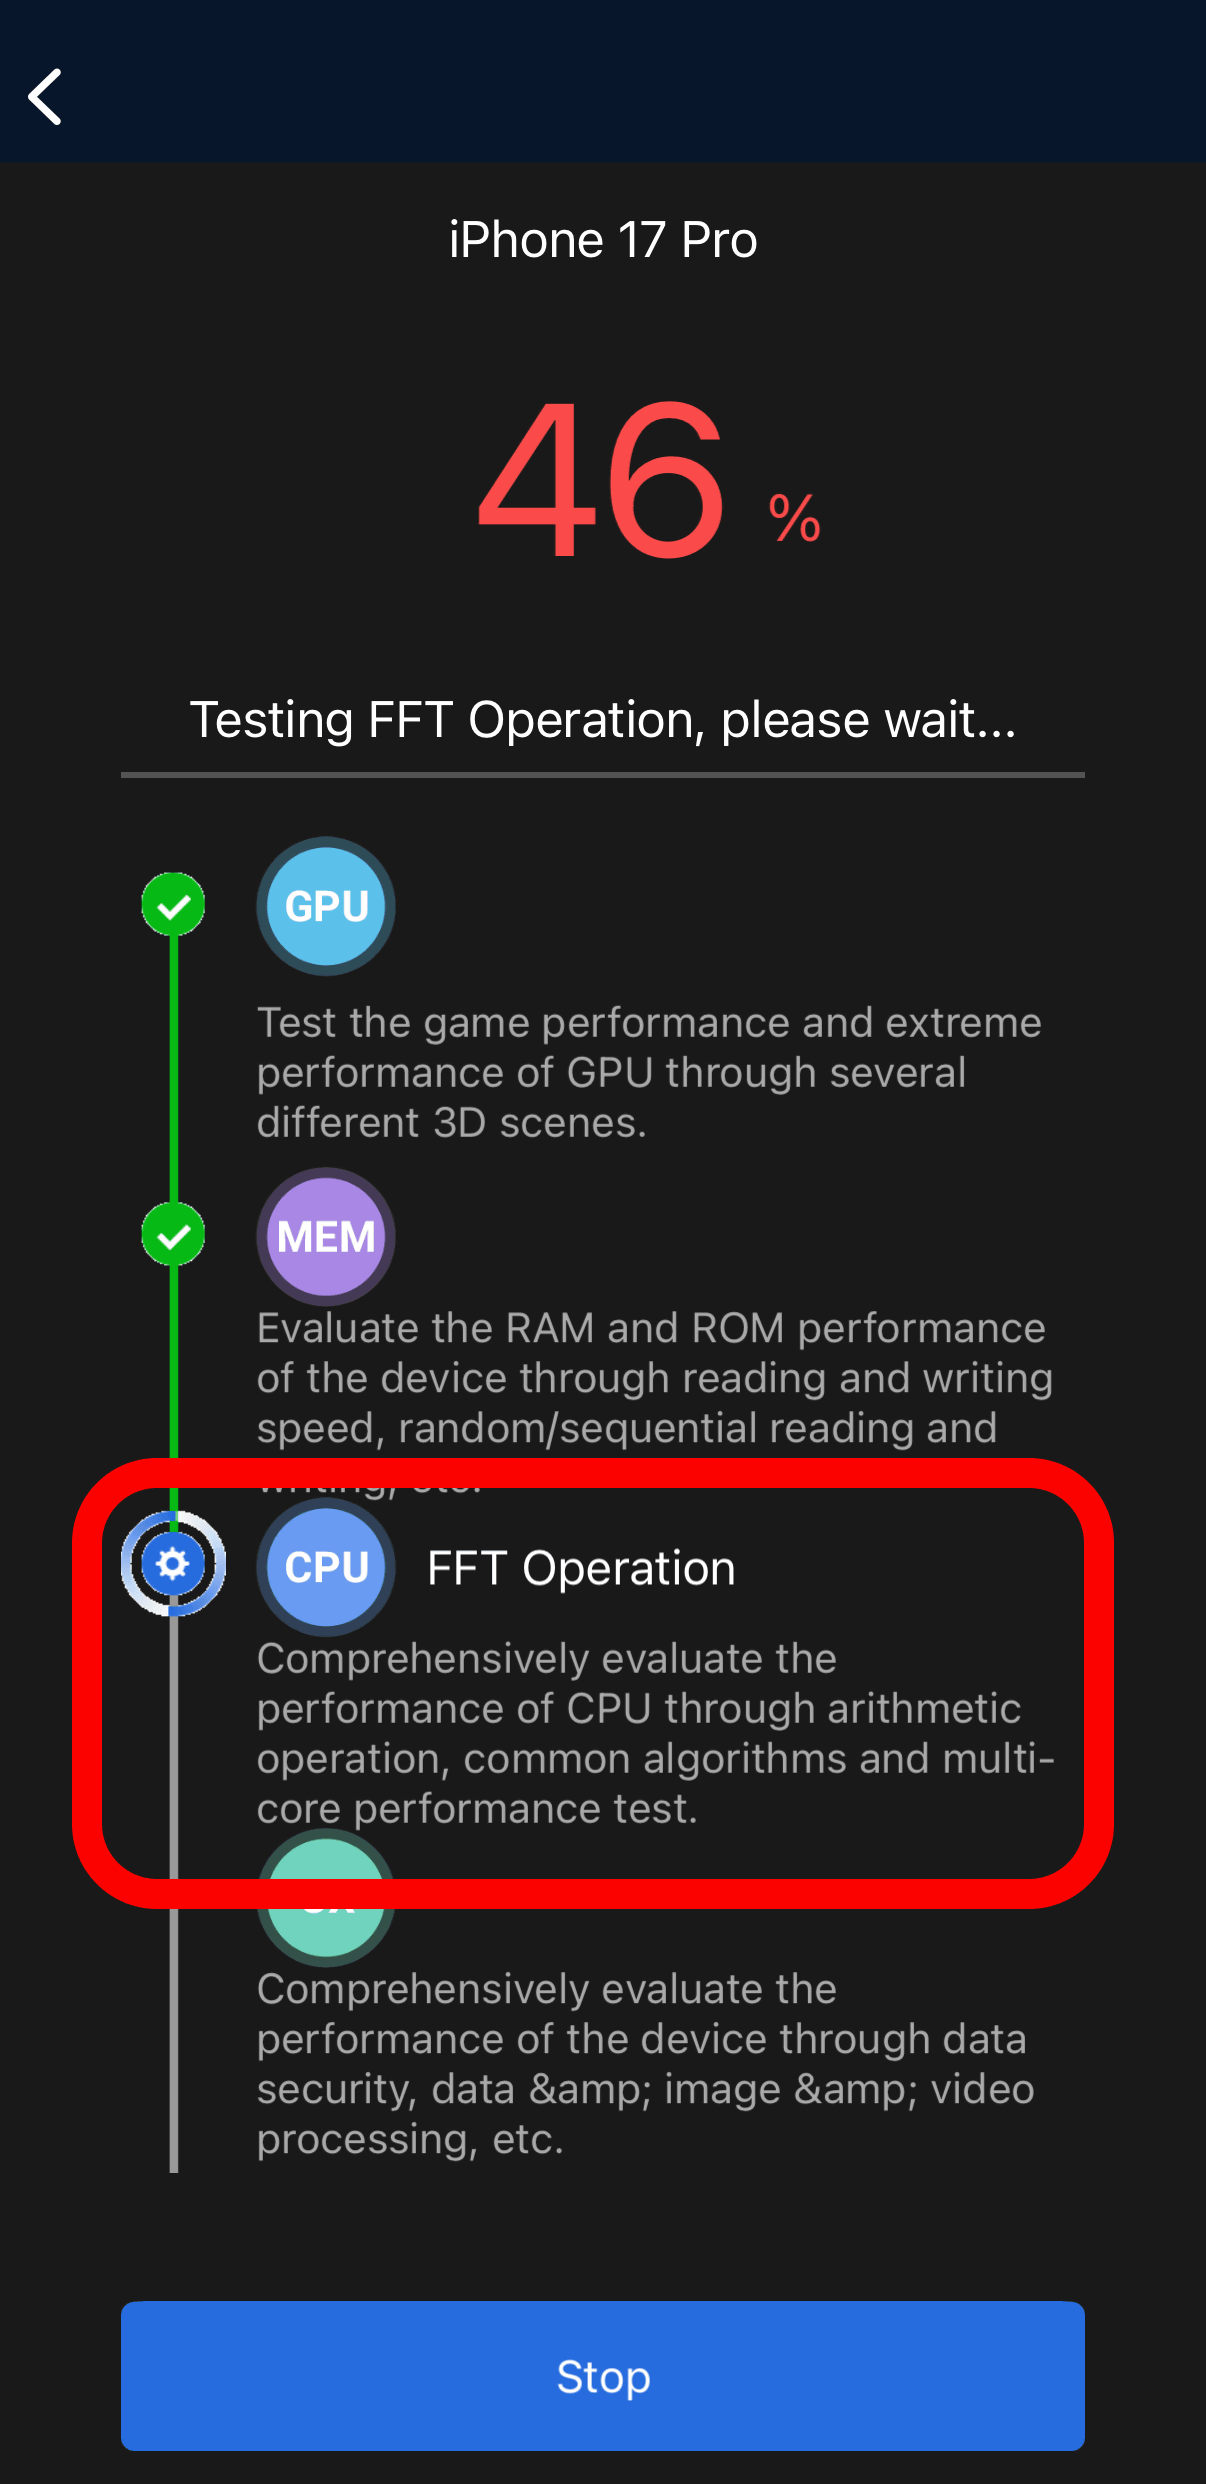
Next is the CPU performance test, which comprehensively evaluates the CPU's performance through arithmetic operations, common algorithms, and multi-core performance tests.
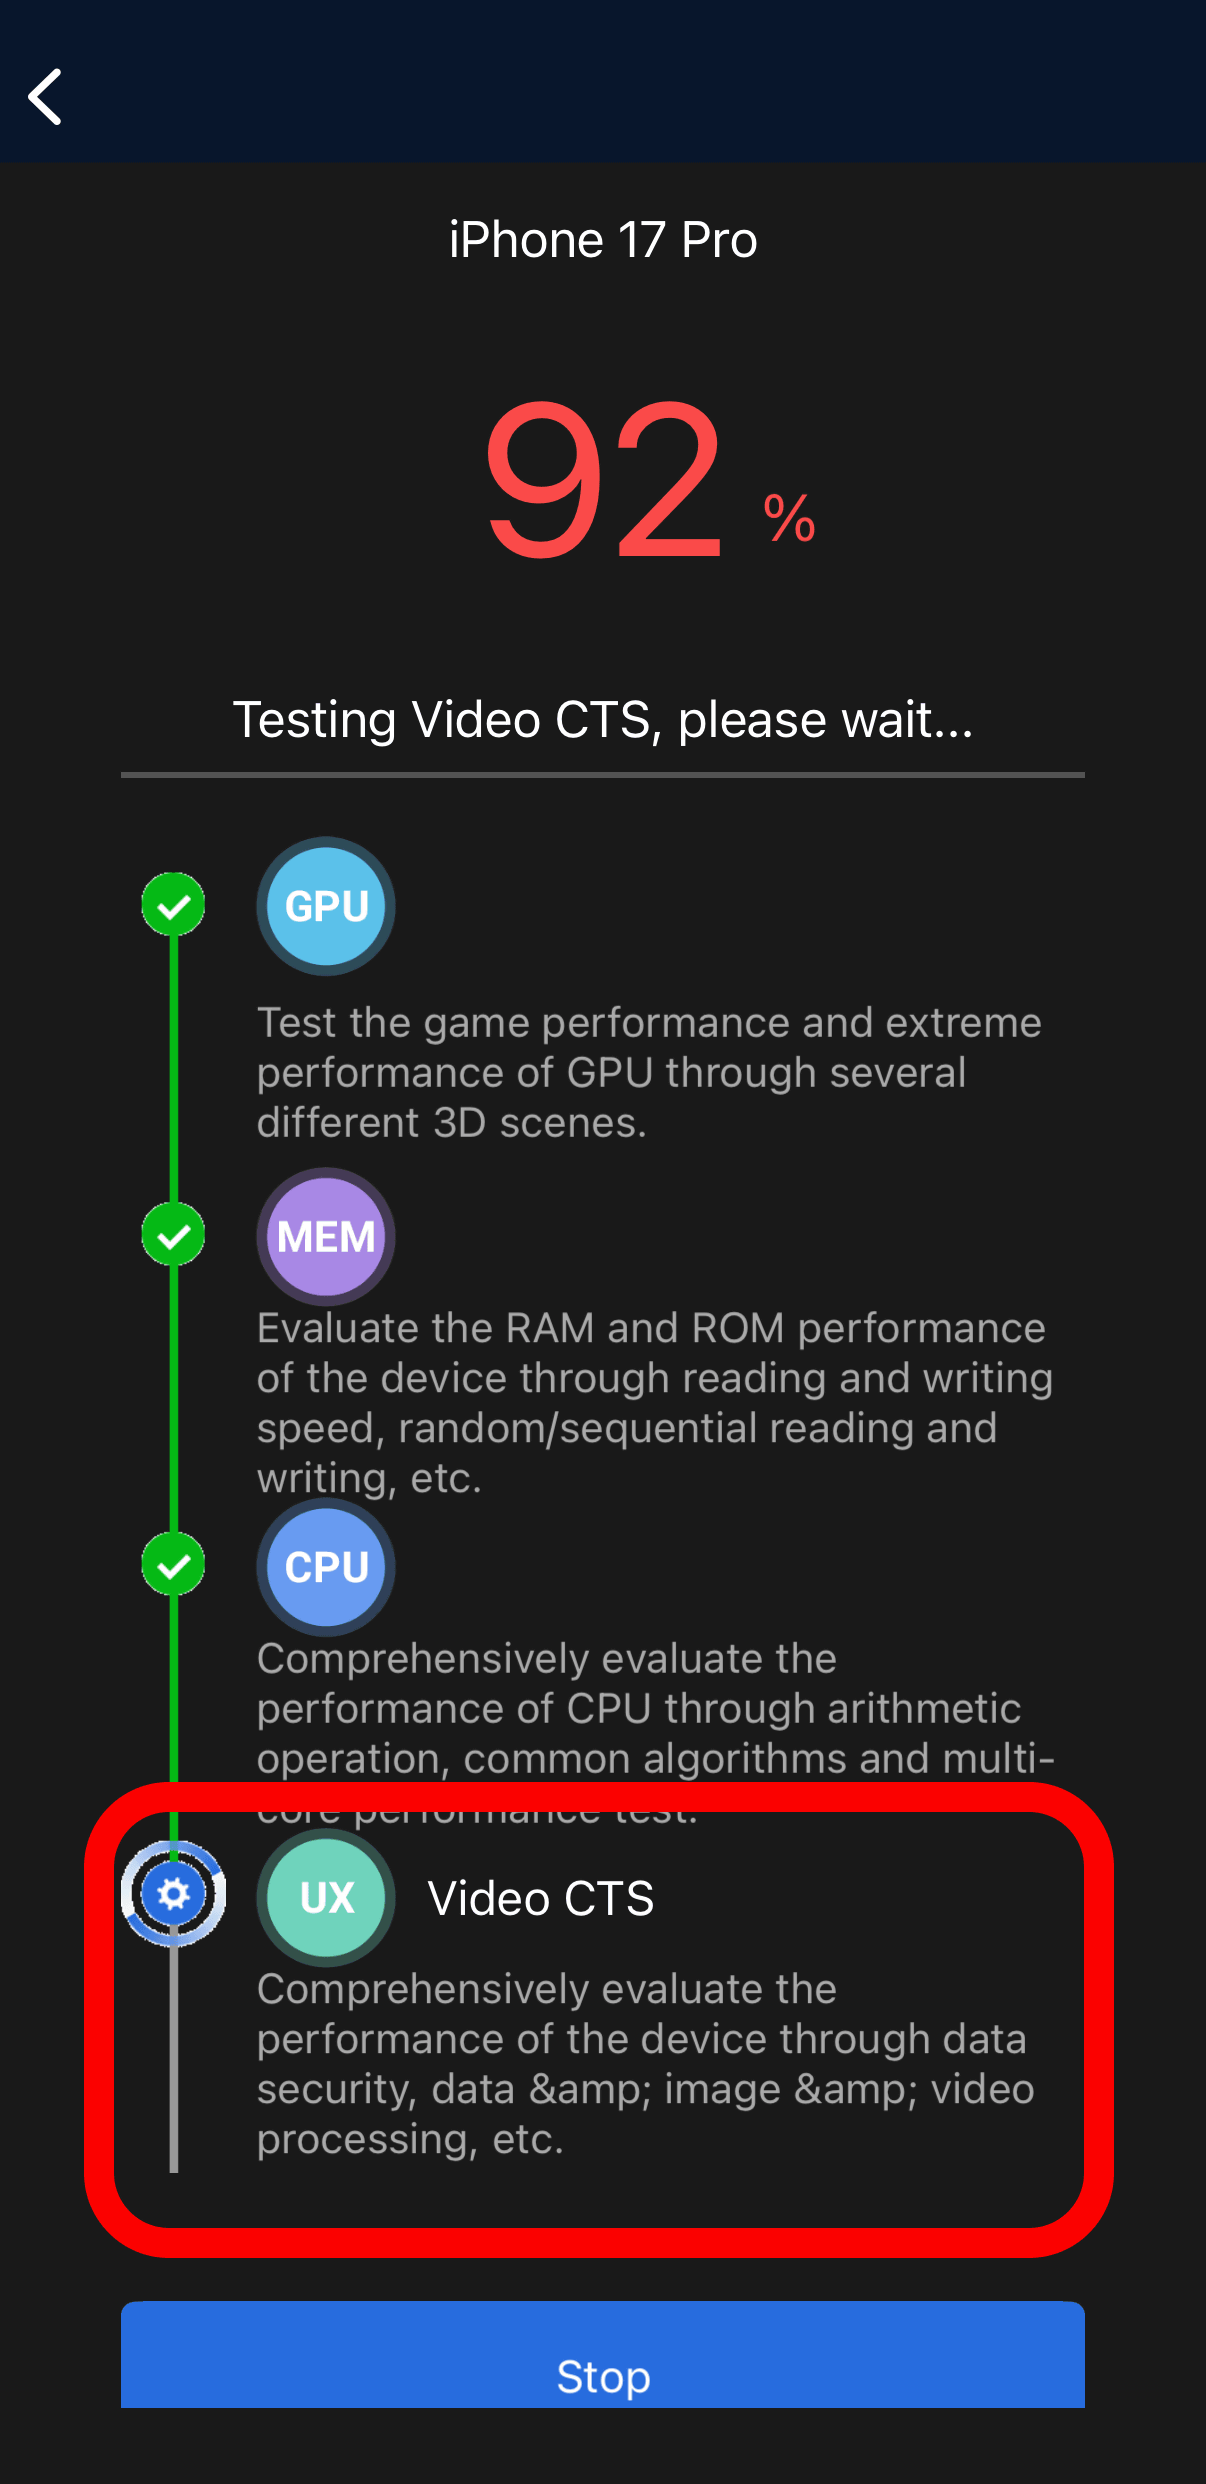
Finally, UX, or user experience, is measured, which is a metric that quantifies everyday operability such as screen load speed, app switching, and responsiveness.
A demonstration of displaying and scrolling through social media in a browser.

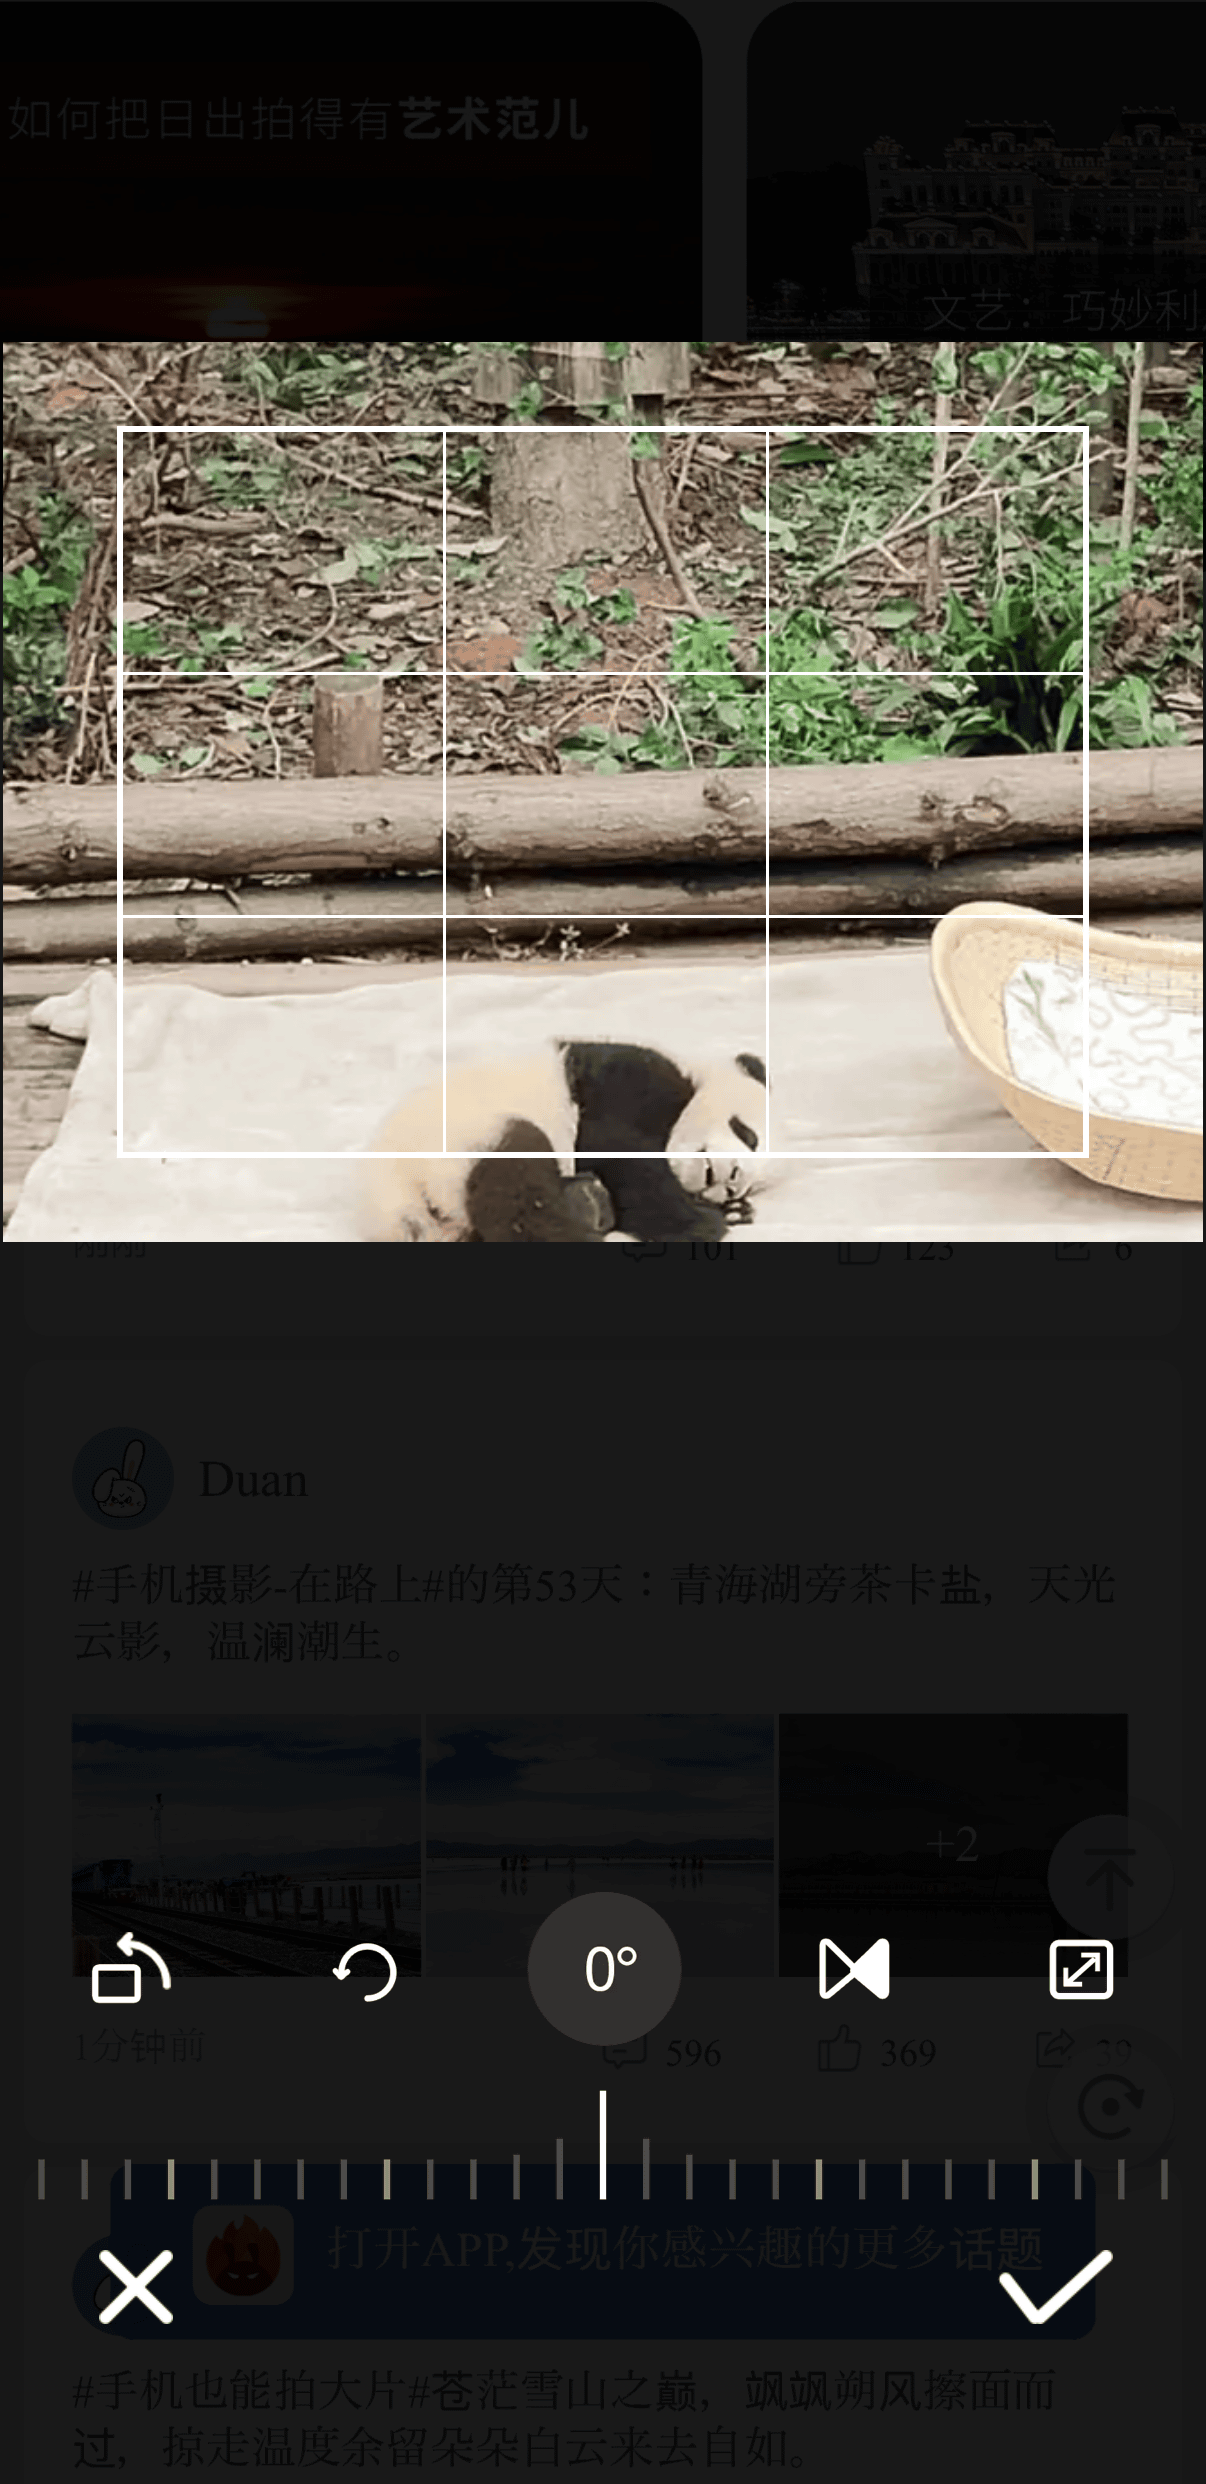
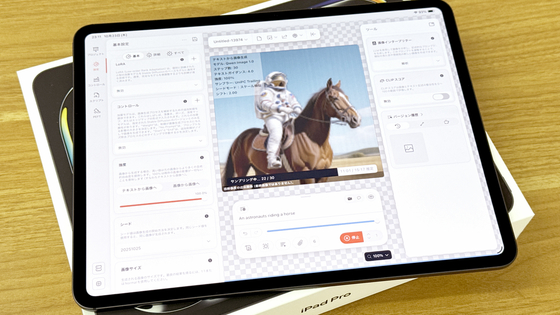
Image editing test
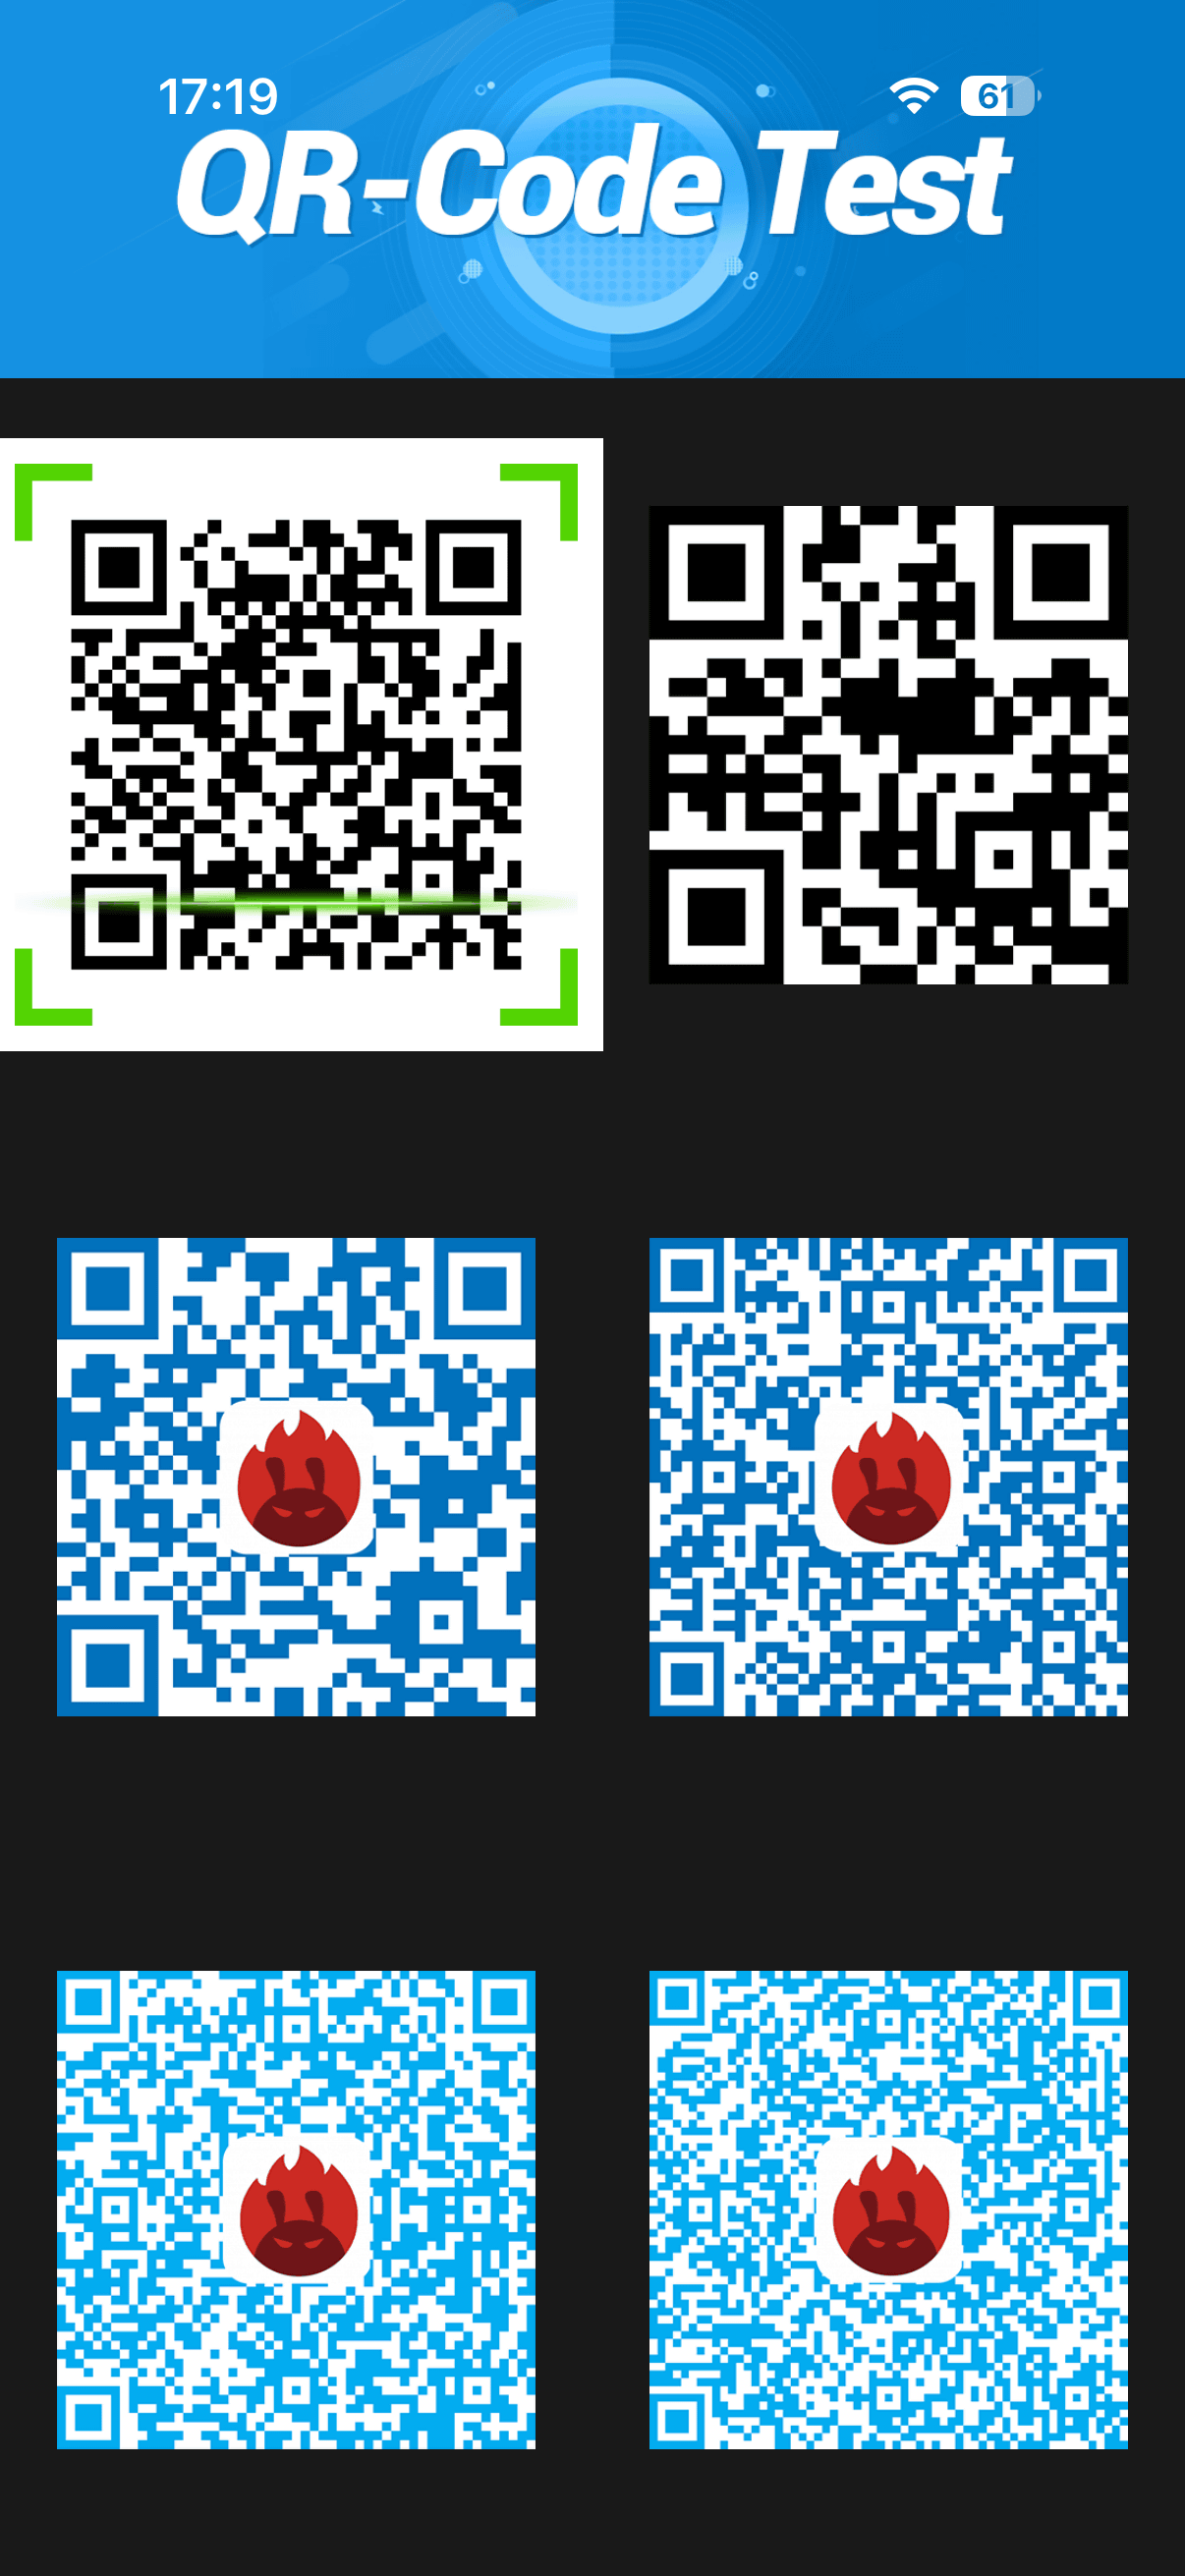
Tests were also conducted to quickly read a large number of QR codes.
4K video decoding is done using codecs such as AV1, H.265, and H.264.

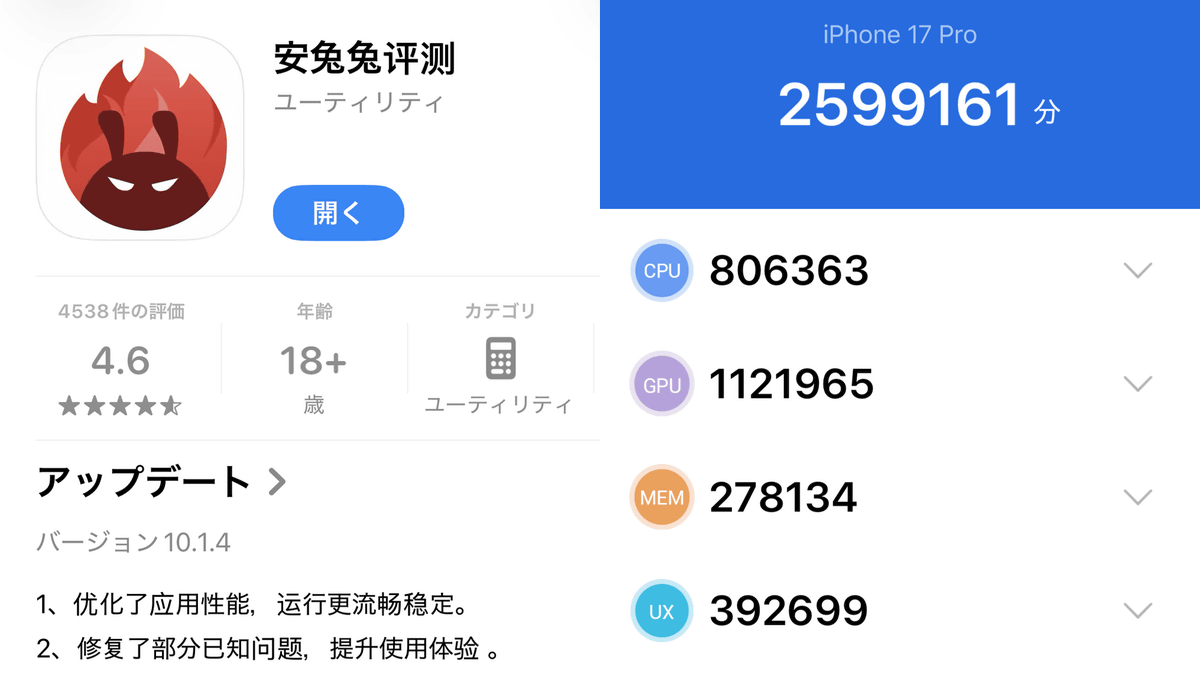
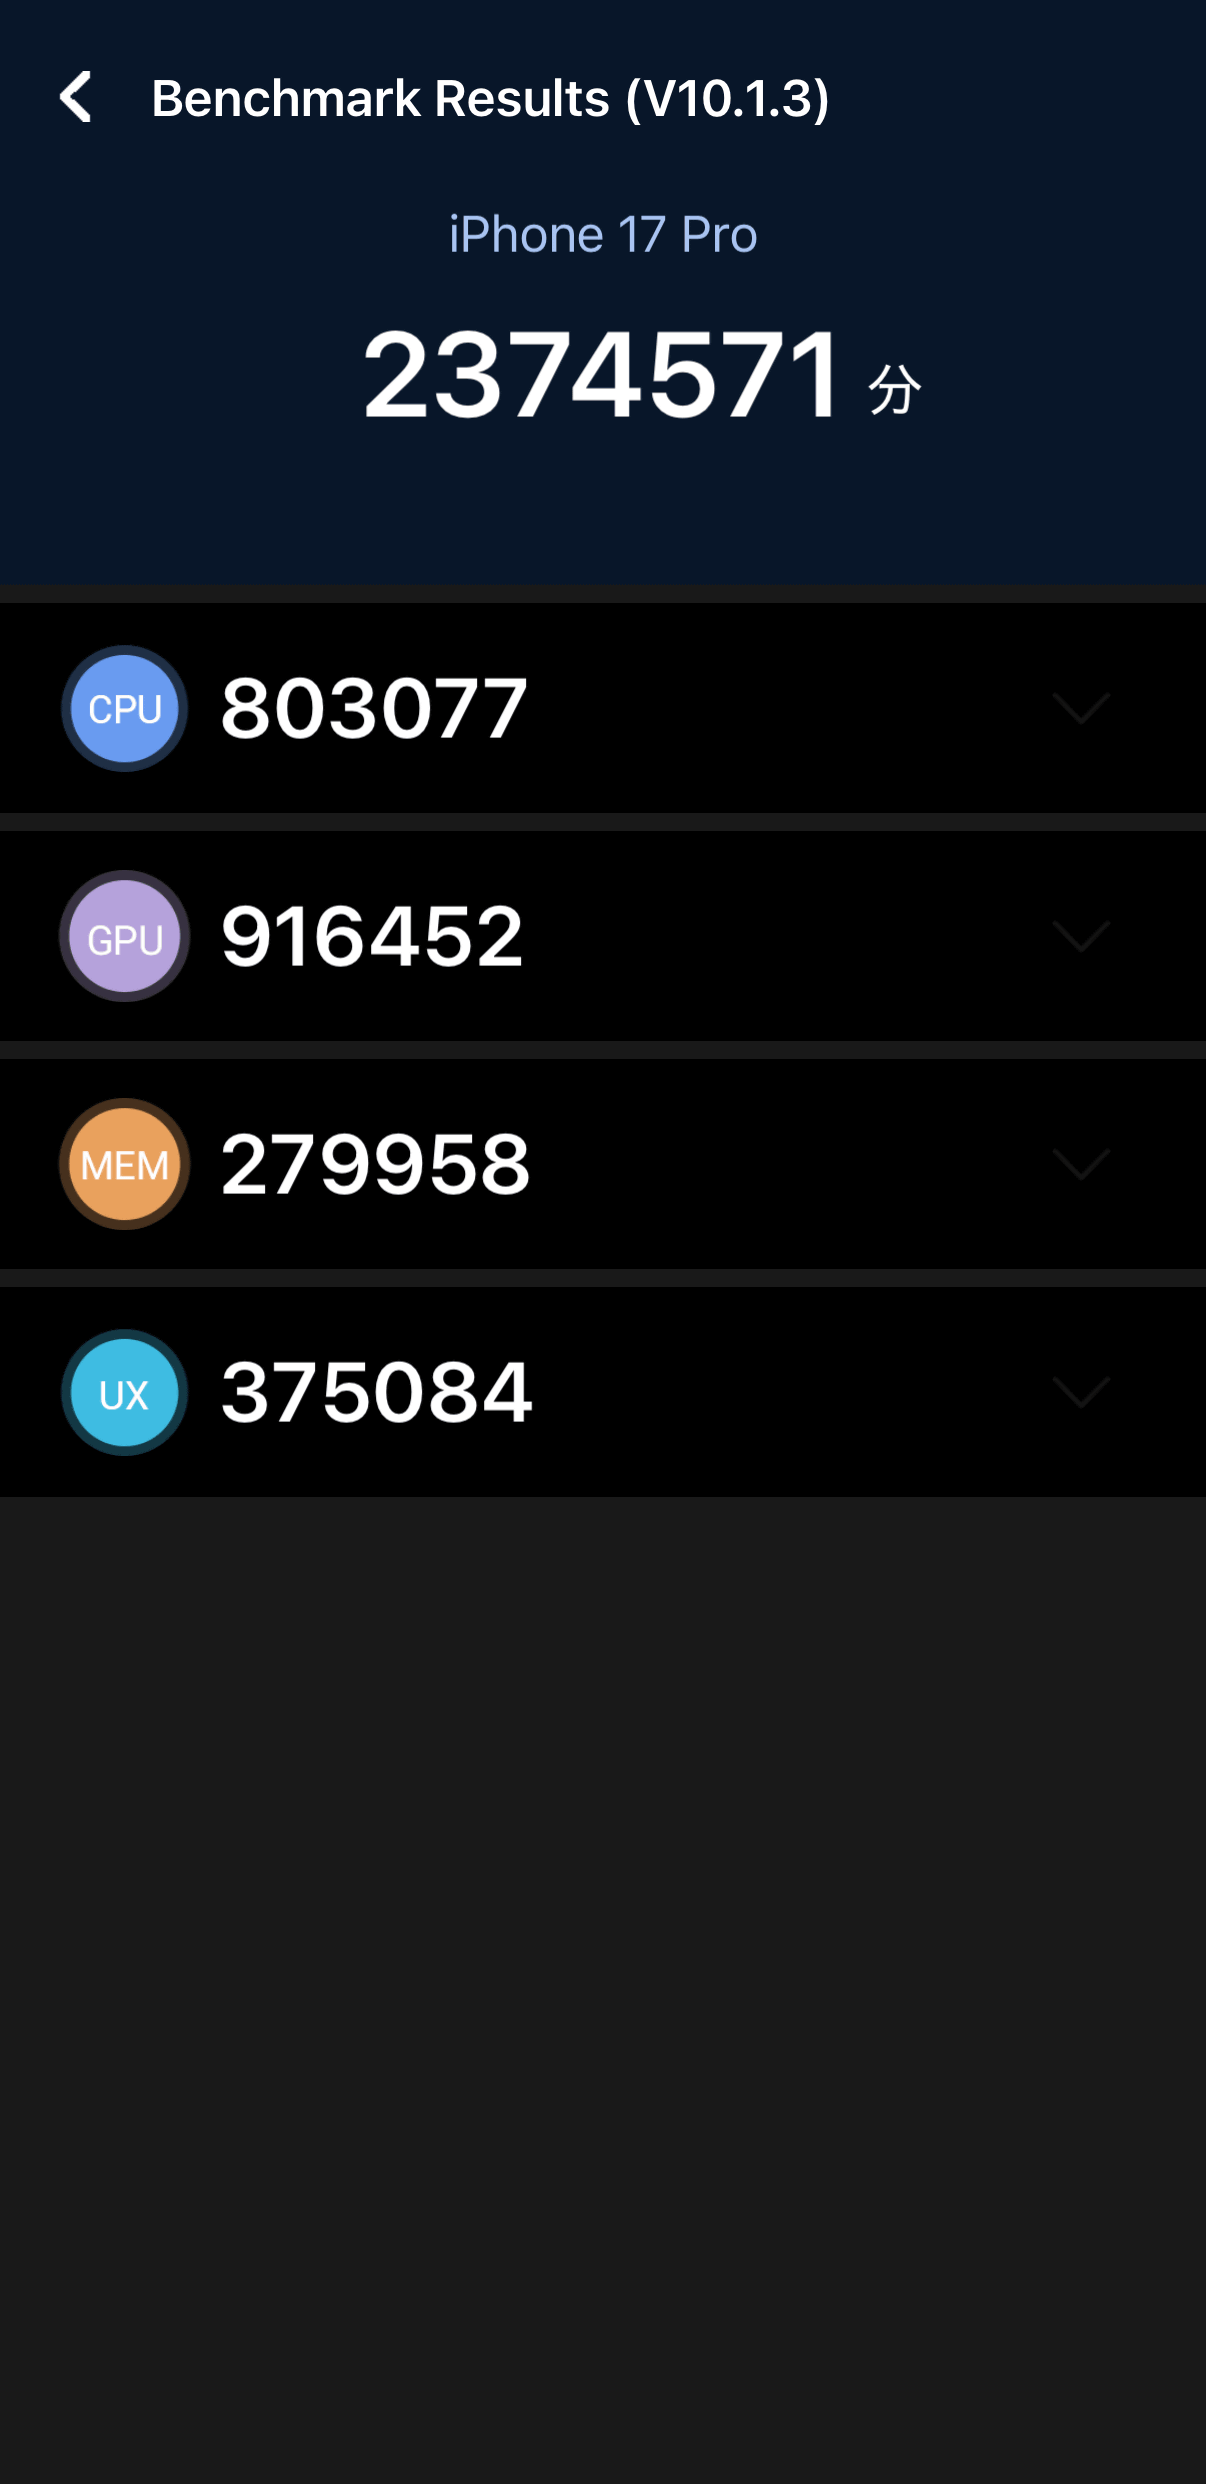
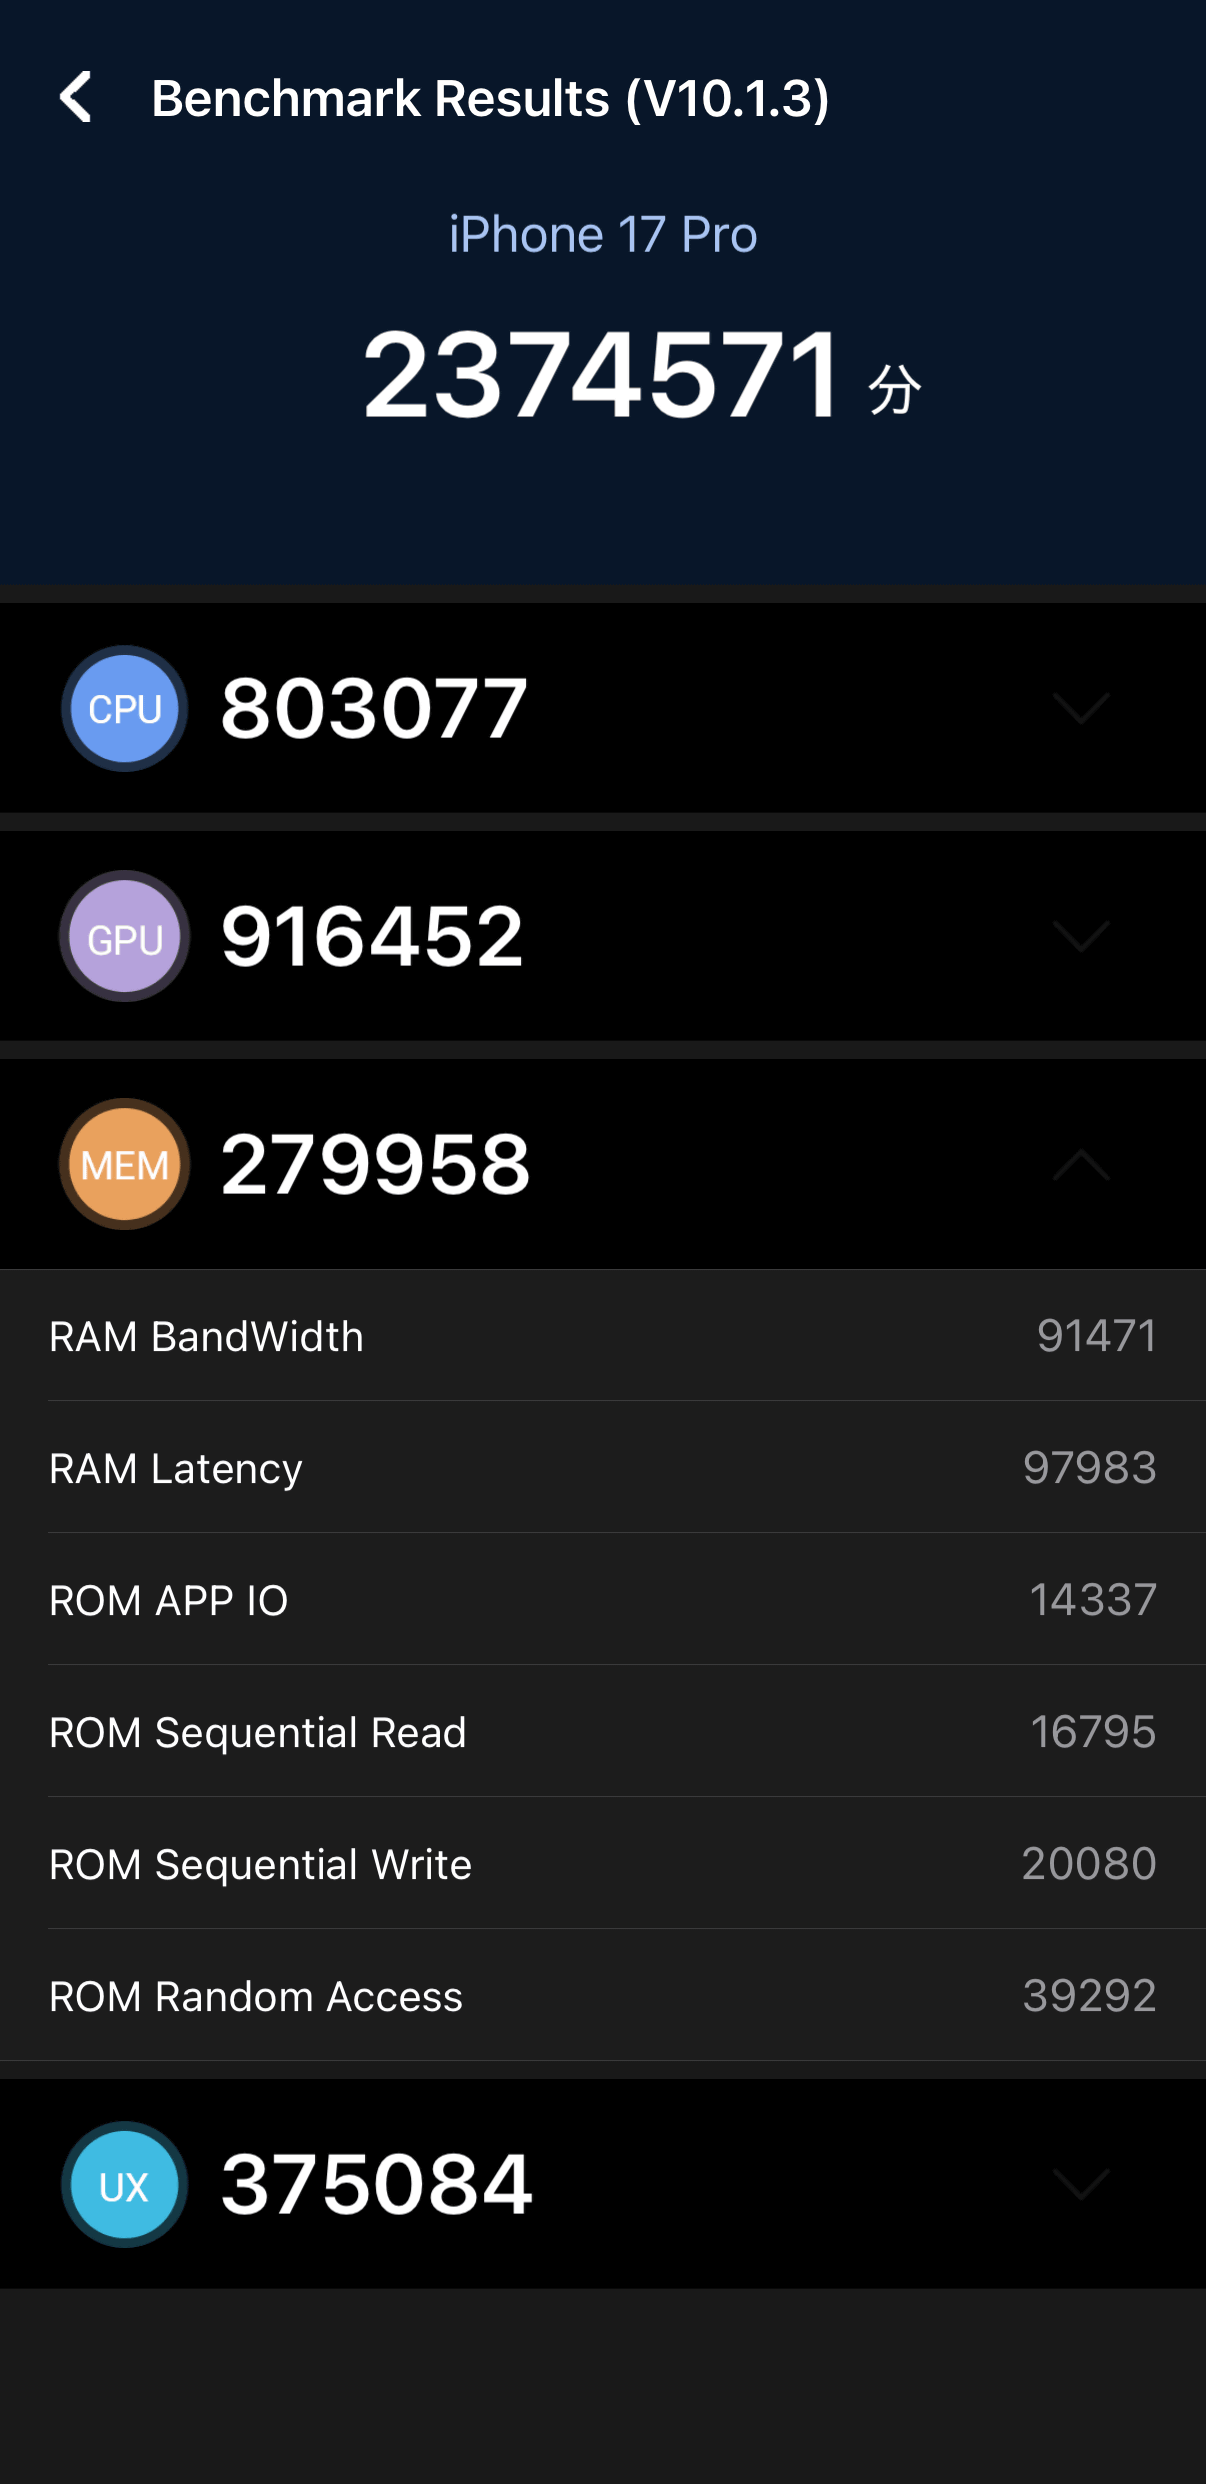
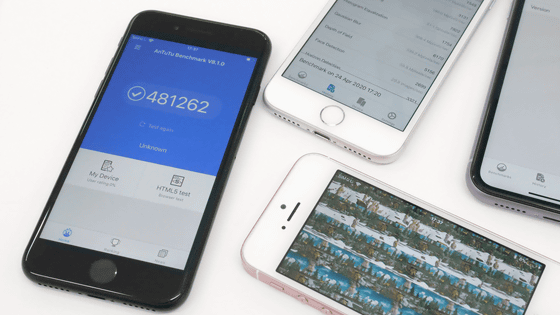
The results are calculated as scores for the four items, as shown below, and the total is displayed as the final score. In this benchmark, the total score was 2,374,571 points, with the breakdown being CPU 803,077 points, CPU 916,452 points, memory 279,958 points, and UX 375,084 points. The higher the score, the better the benchmark result.
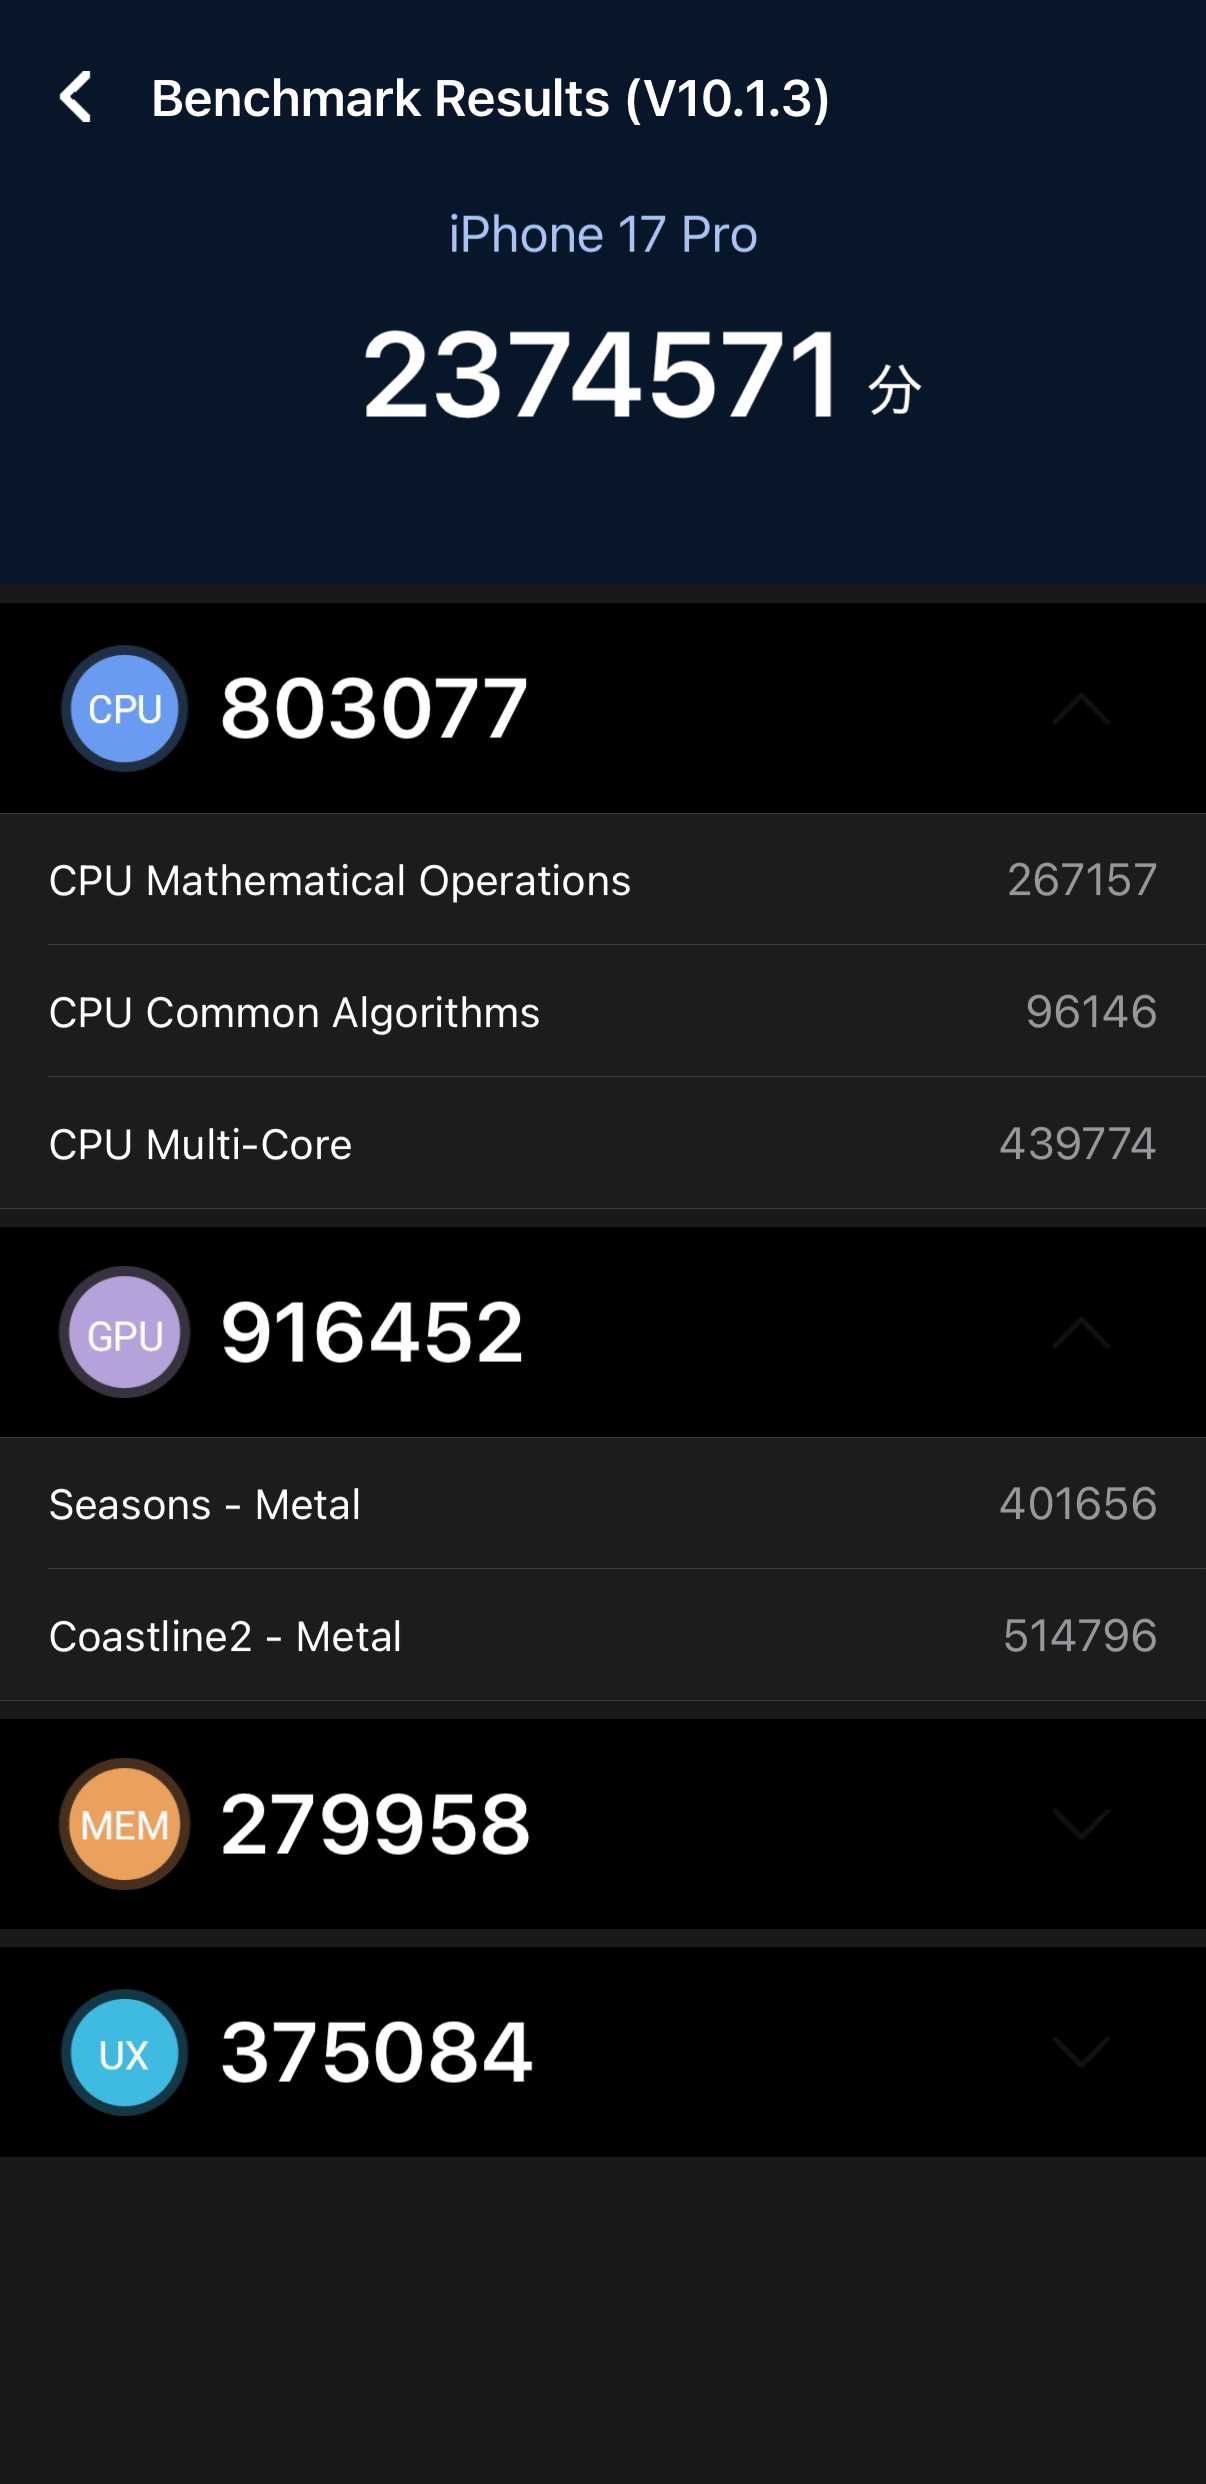
You can see a further breakdown by tapping on each item. For example, CPU arithmetic operations scored 267,157 points, common algorithms scored 96,146 points, and multi-core performance scored 439,774 points. The GPU 'Seasons' and 'Coastline2' are the titles of the demo movies played in the rendering test, and the rendering performance score for each movie is shown.
For memory, bandwidth (RAM Bandwidth), latency (RAM Latency), application storage input/output performance (ROM APP IO), storage sequential read speed (ROM Sequential Read), sequential write speed (ROM Sequential Write), and random access speed (ROM Random Access) are measured.
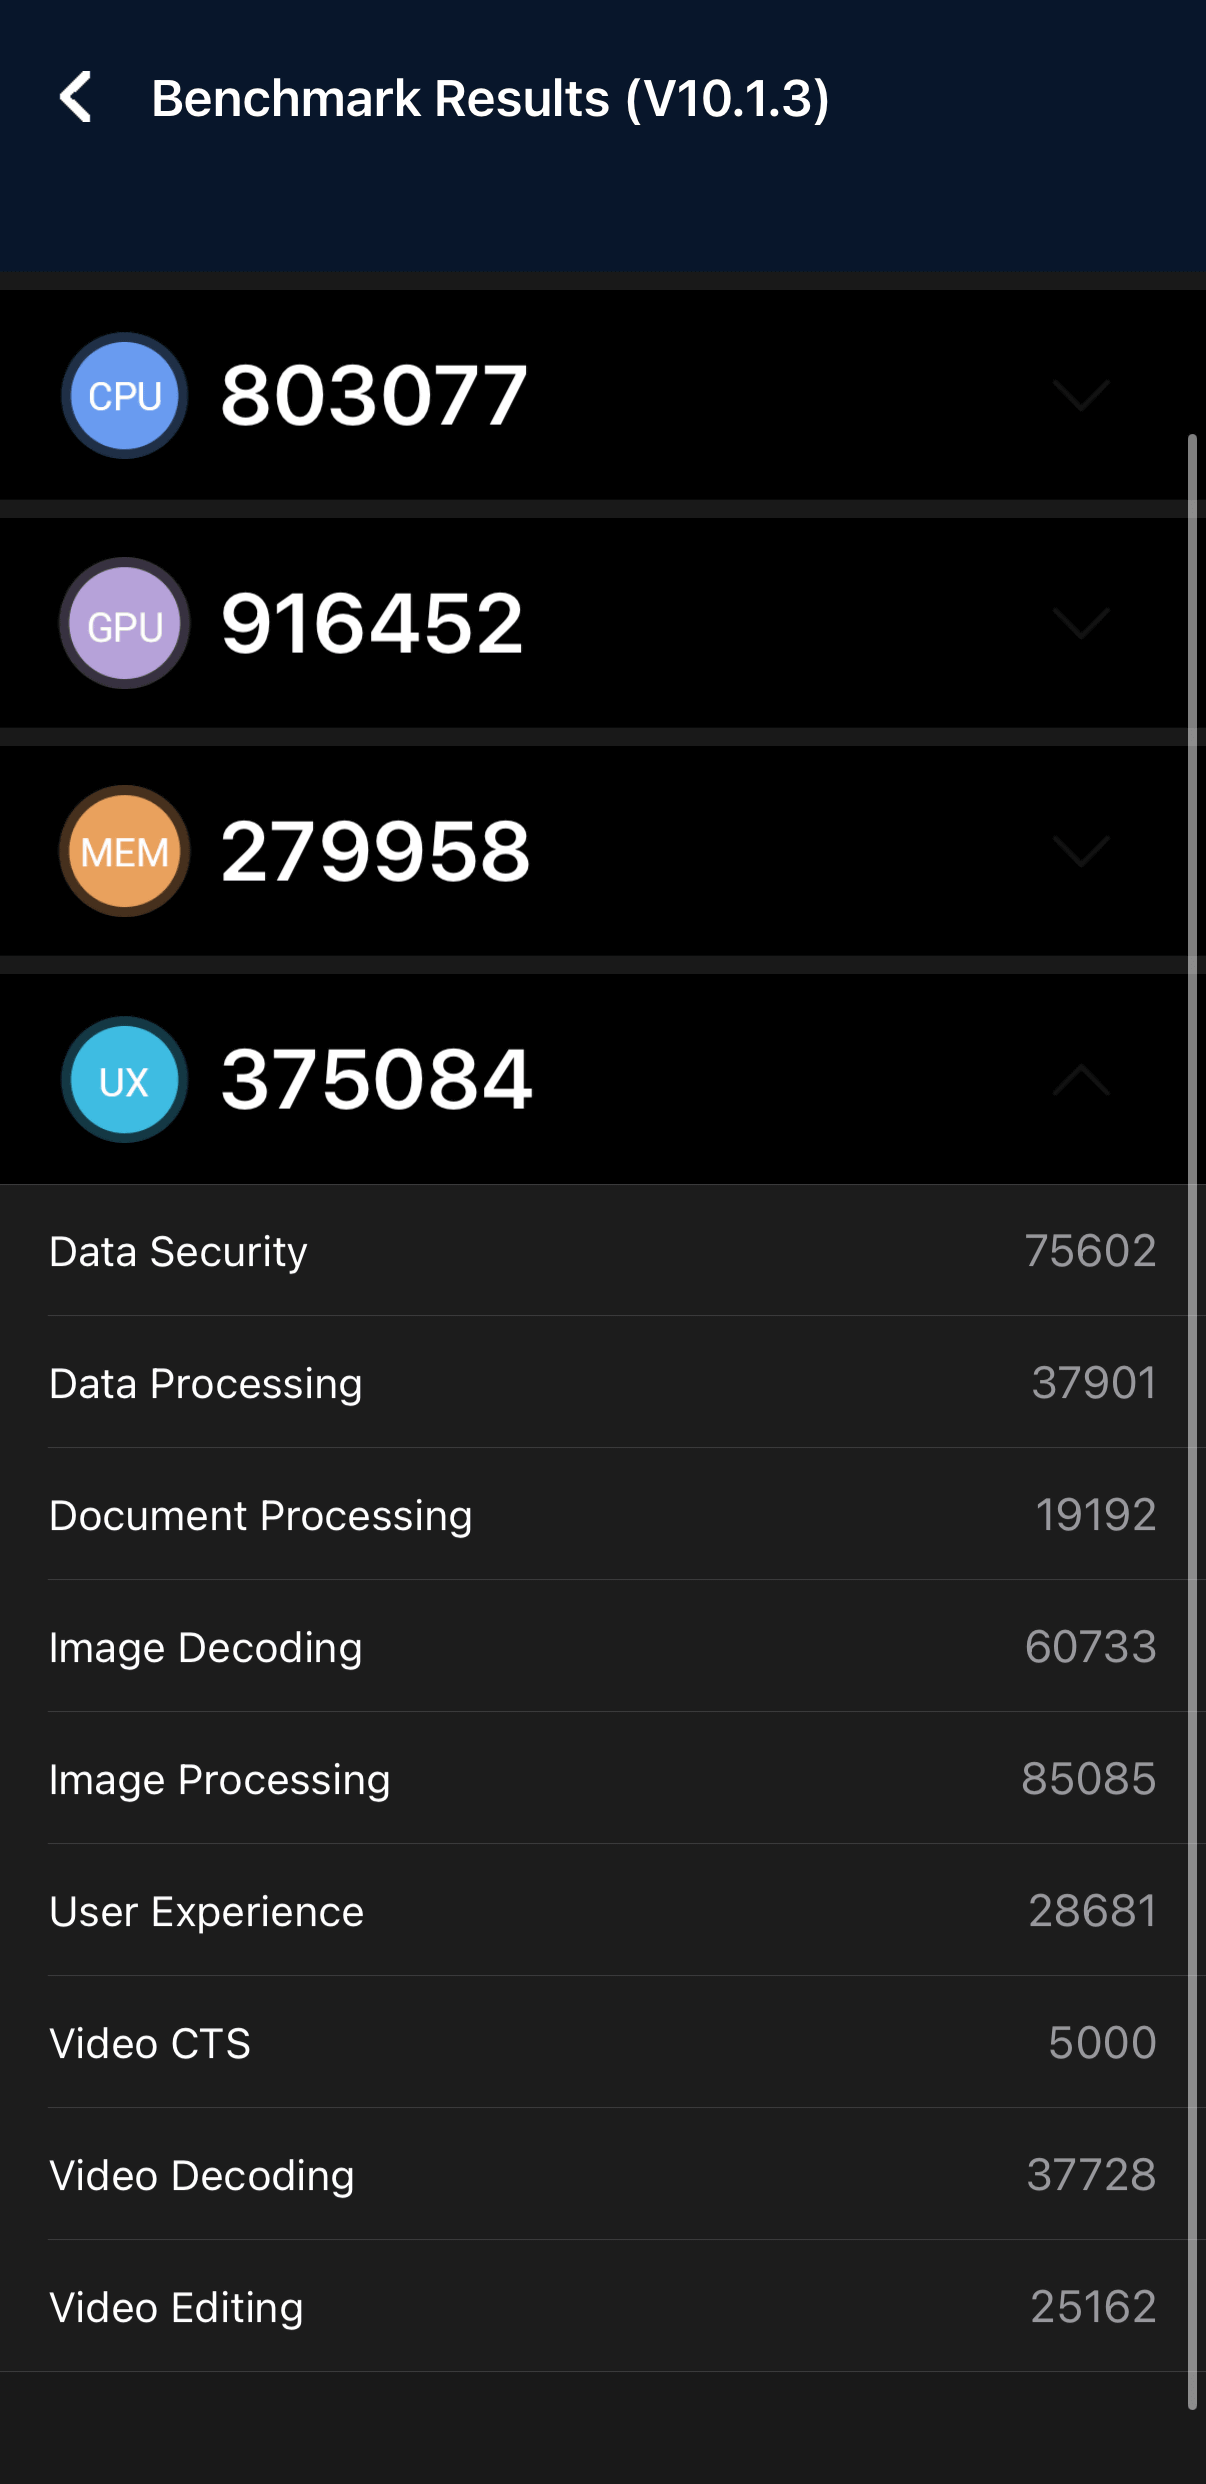
The UX measurement items are Data Security, Data Processing, Document Processing, Image Decoding, Image Processing, User Experience, Video CTS, Video Decoding, and Video Editing.
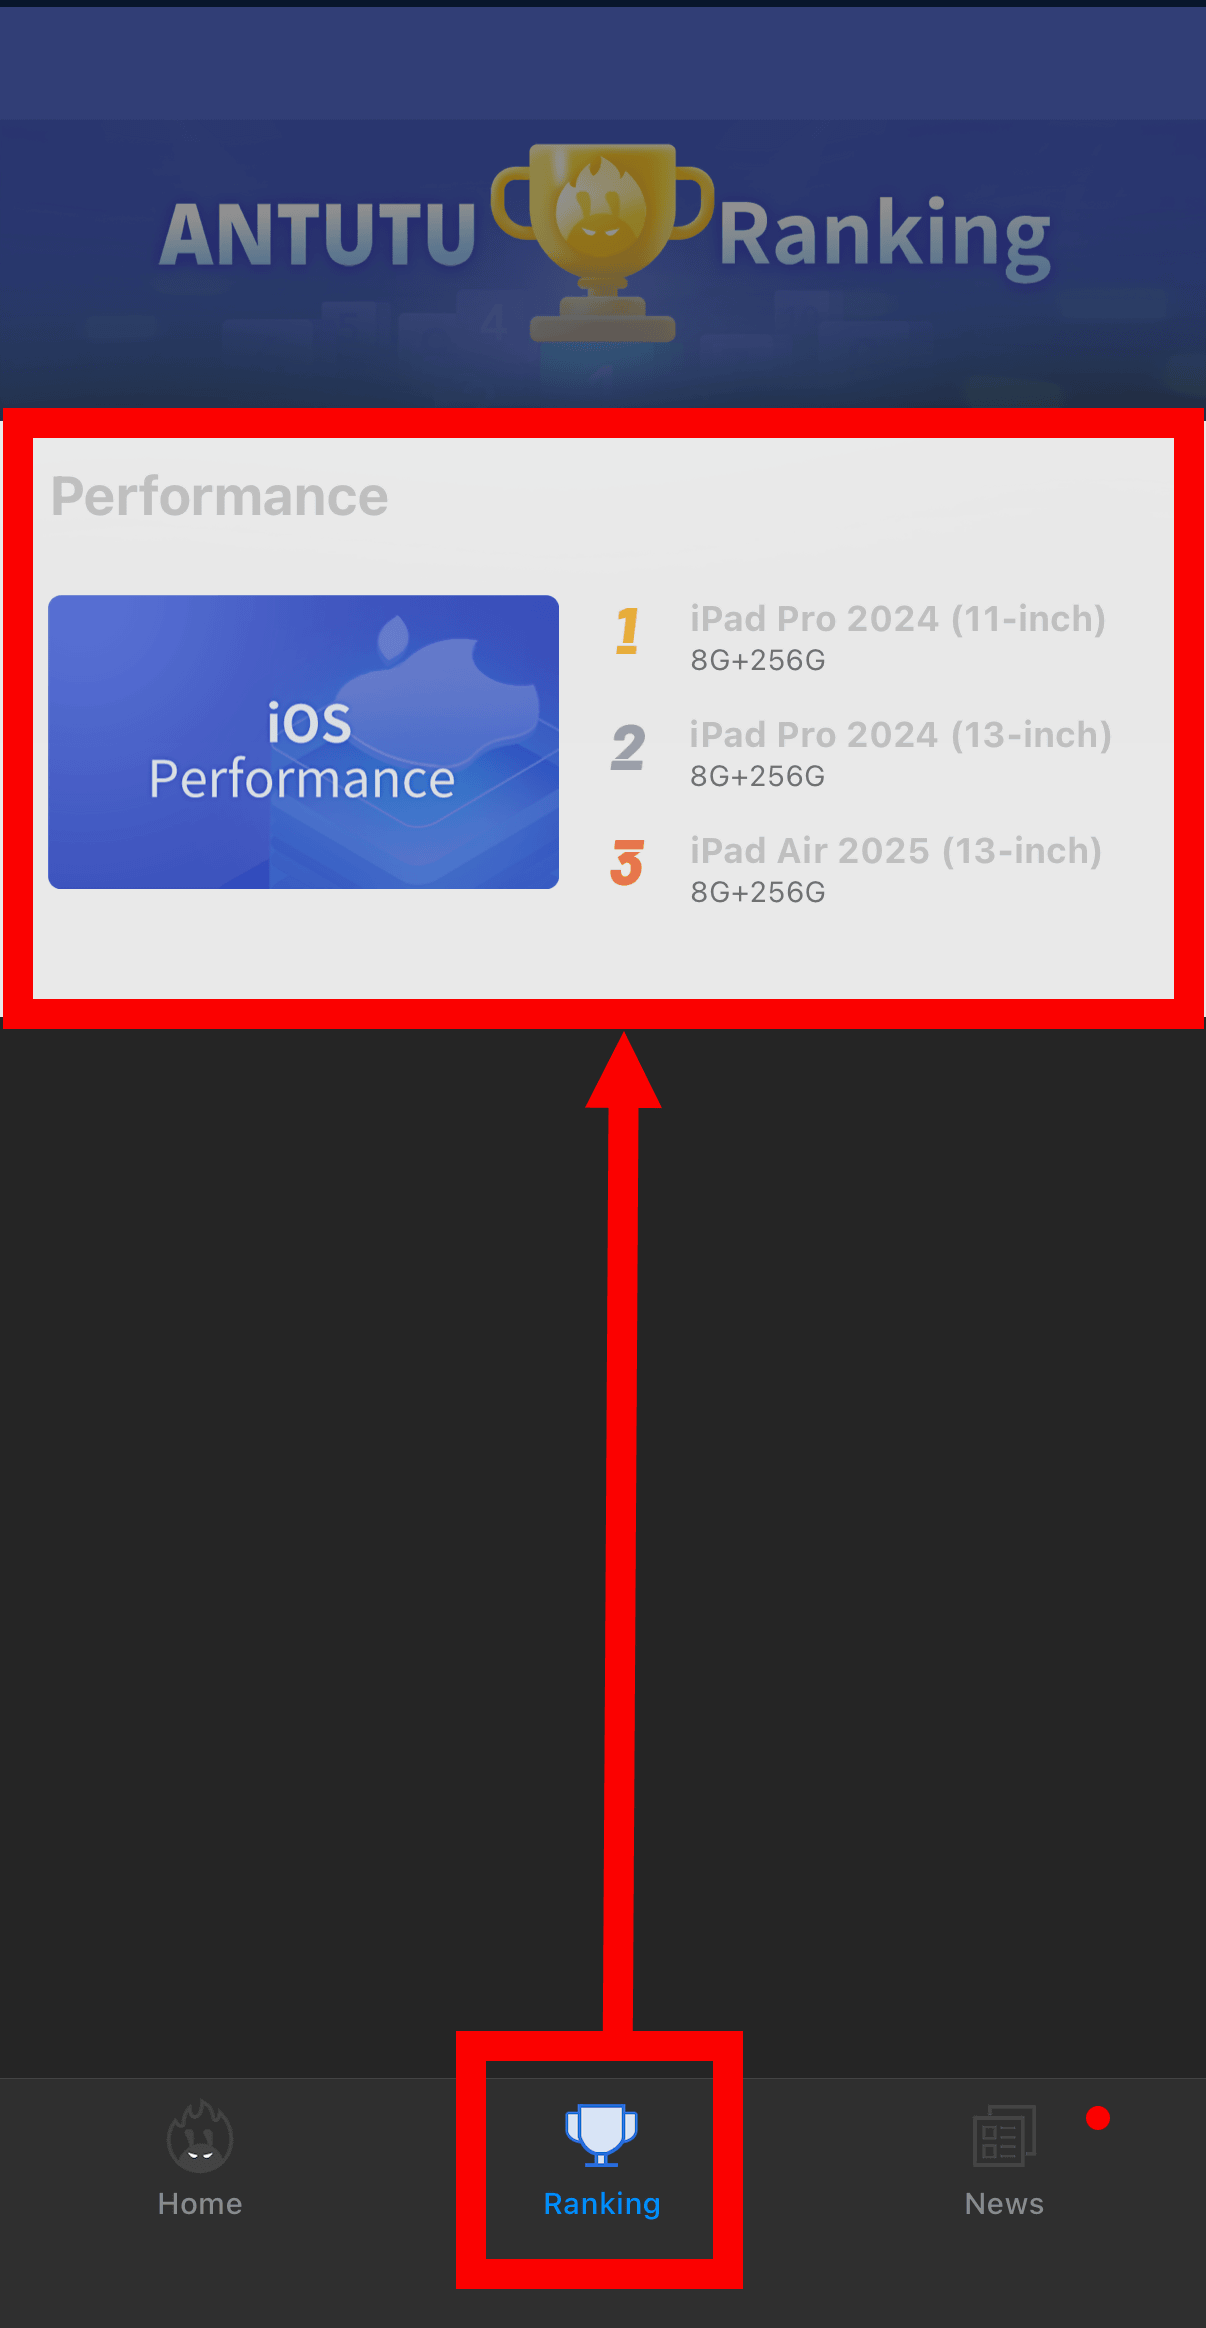
To find out how well your smartphone performs, select 'Ranking' from the tab at the bottom and tap 'Performance.'
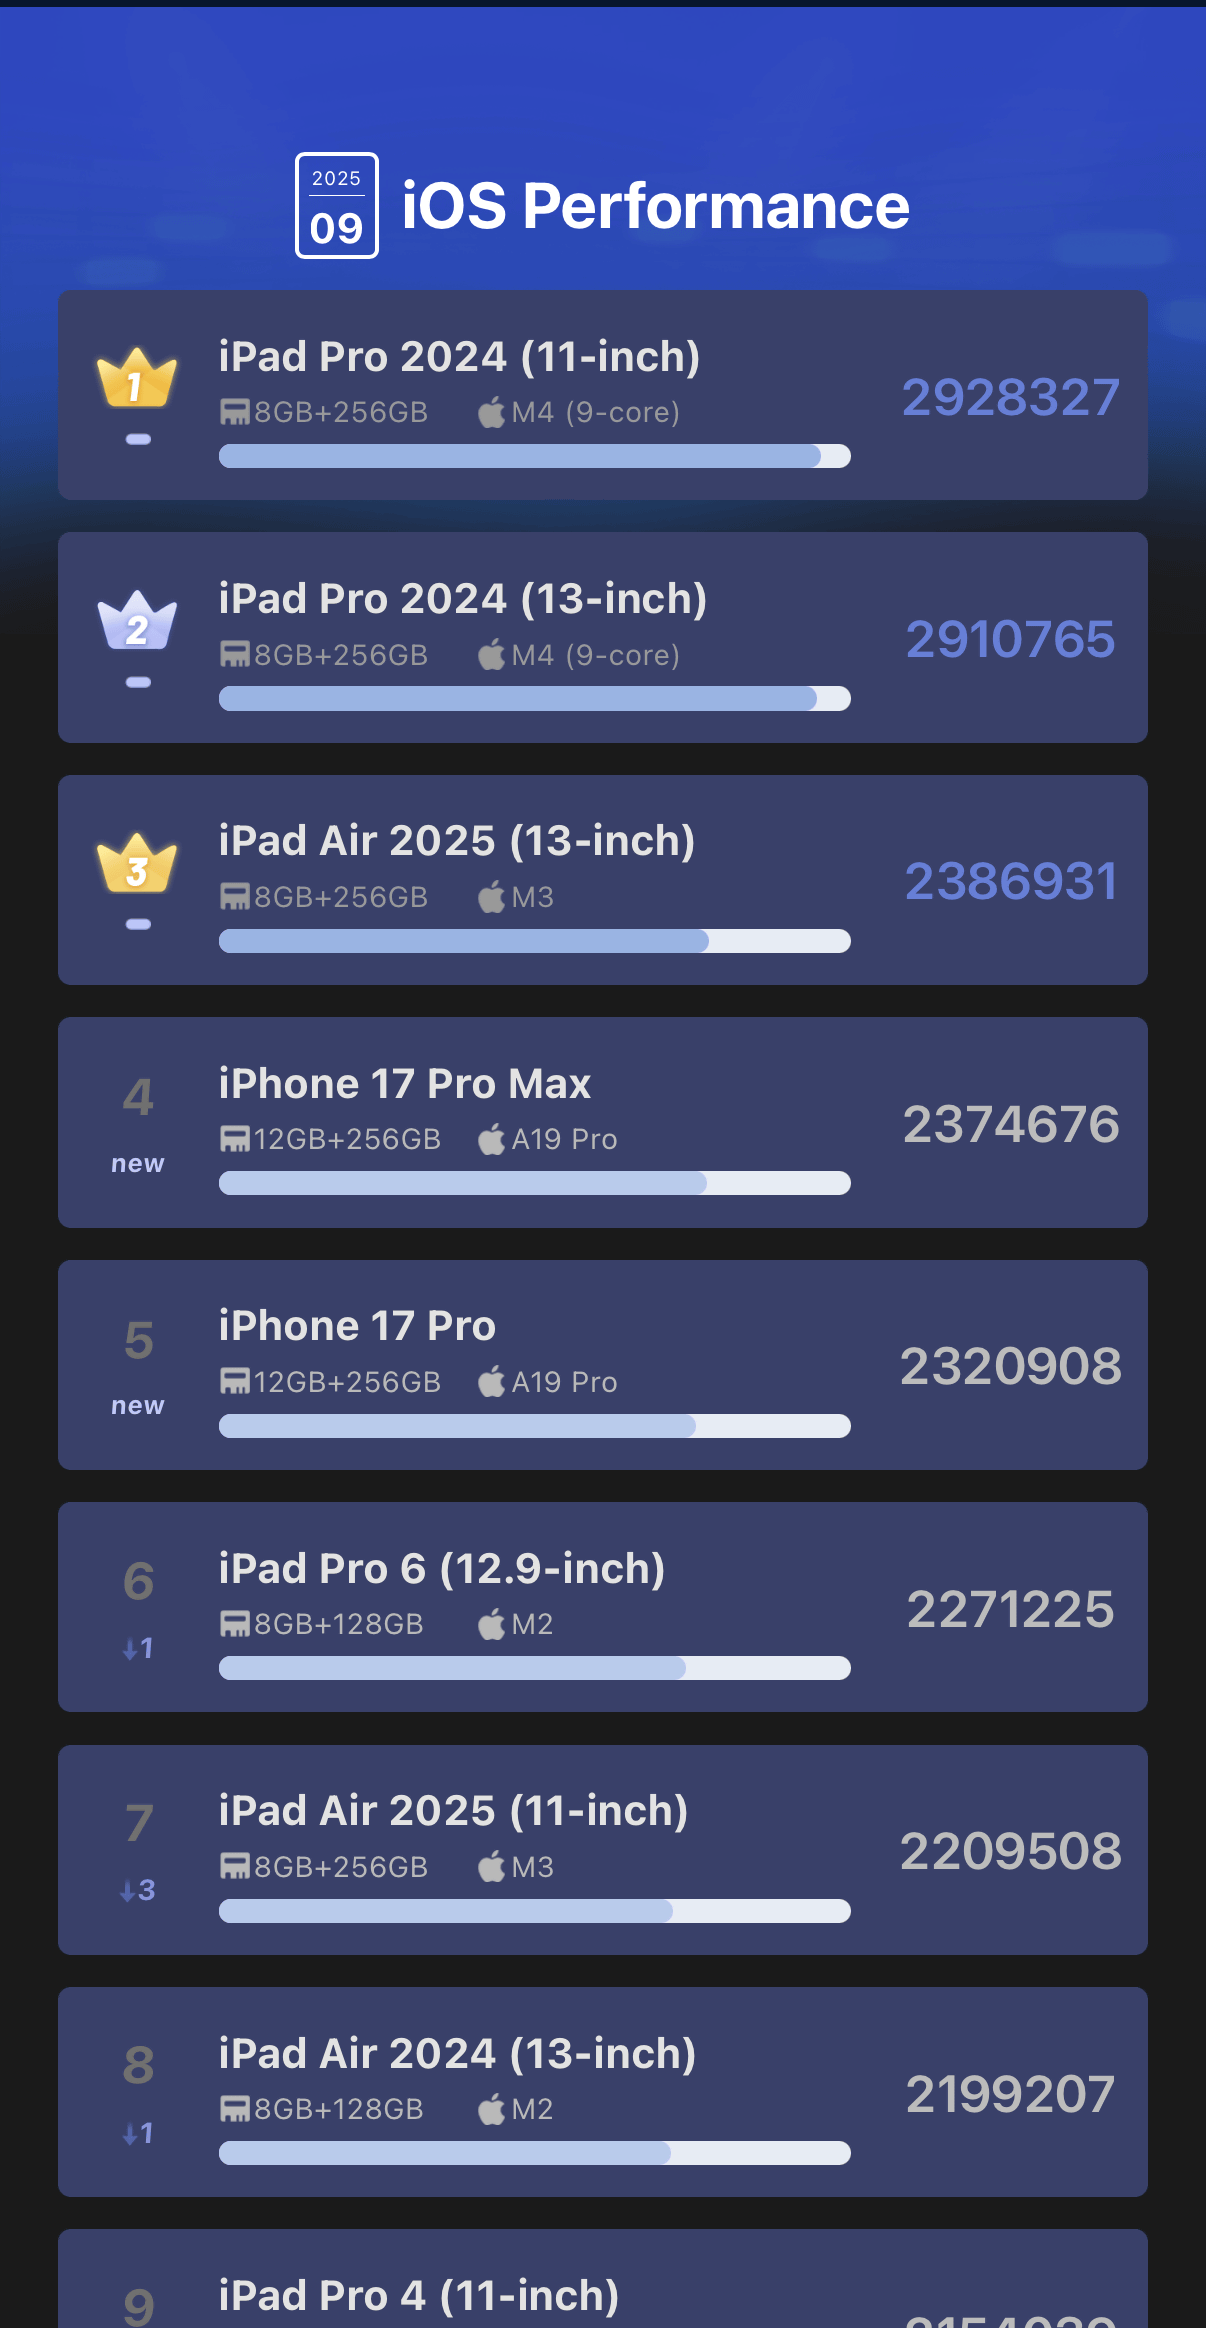
This time, we ran the benchmark on the iOS version, so the results for iOS are shown below. The total score was 2,374,571 points, putting it in the top 5 in the rankings.
Tap 'My Device' on the top screen to check information about the device you are benchmarking.
'Basic Information' is basic information, and 'Storage' is the installed memory and storage capacity.
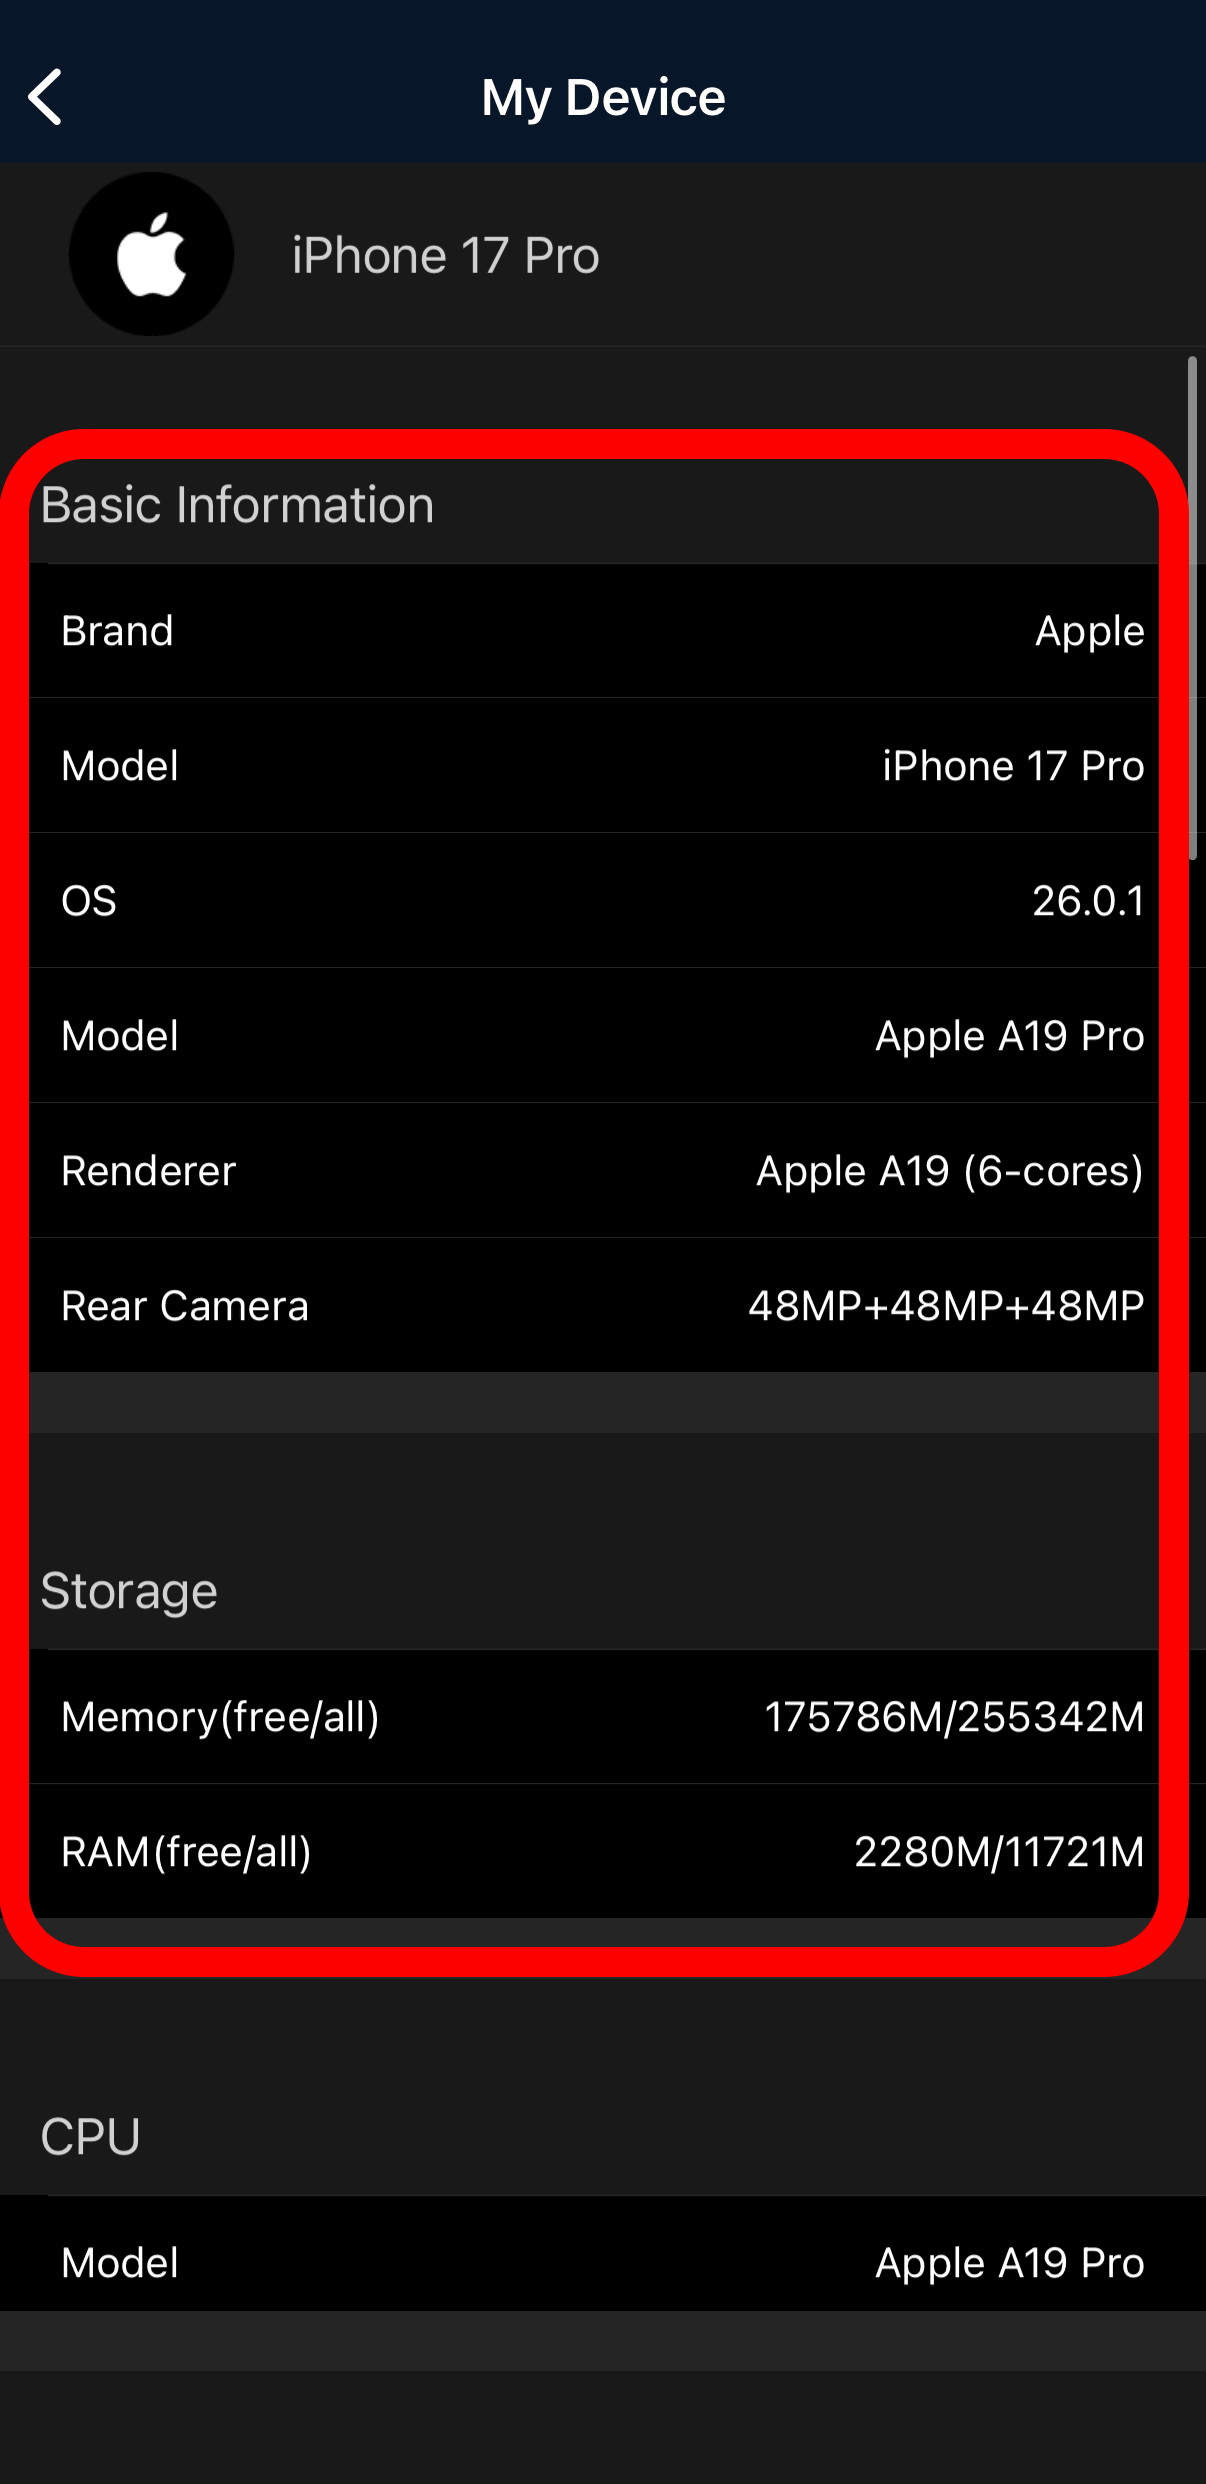
'CPU' is the name of the chip and the number of cores. 'Appearance' is the size and weight of the device.
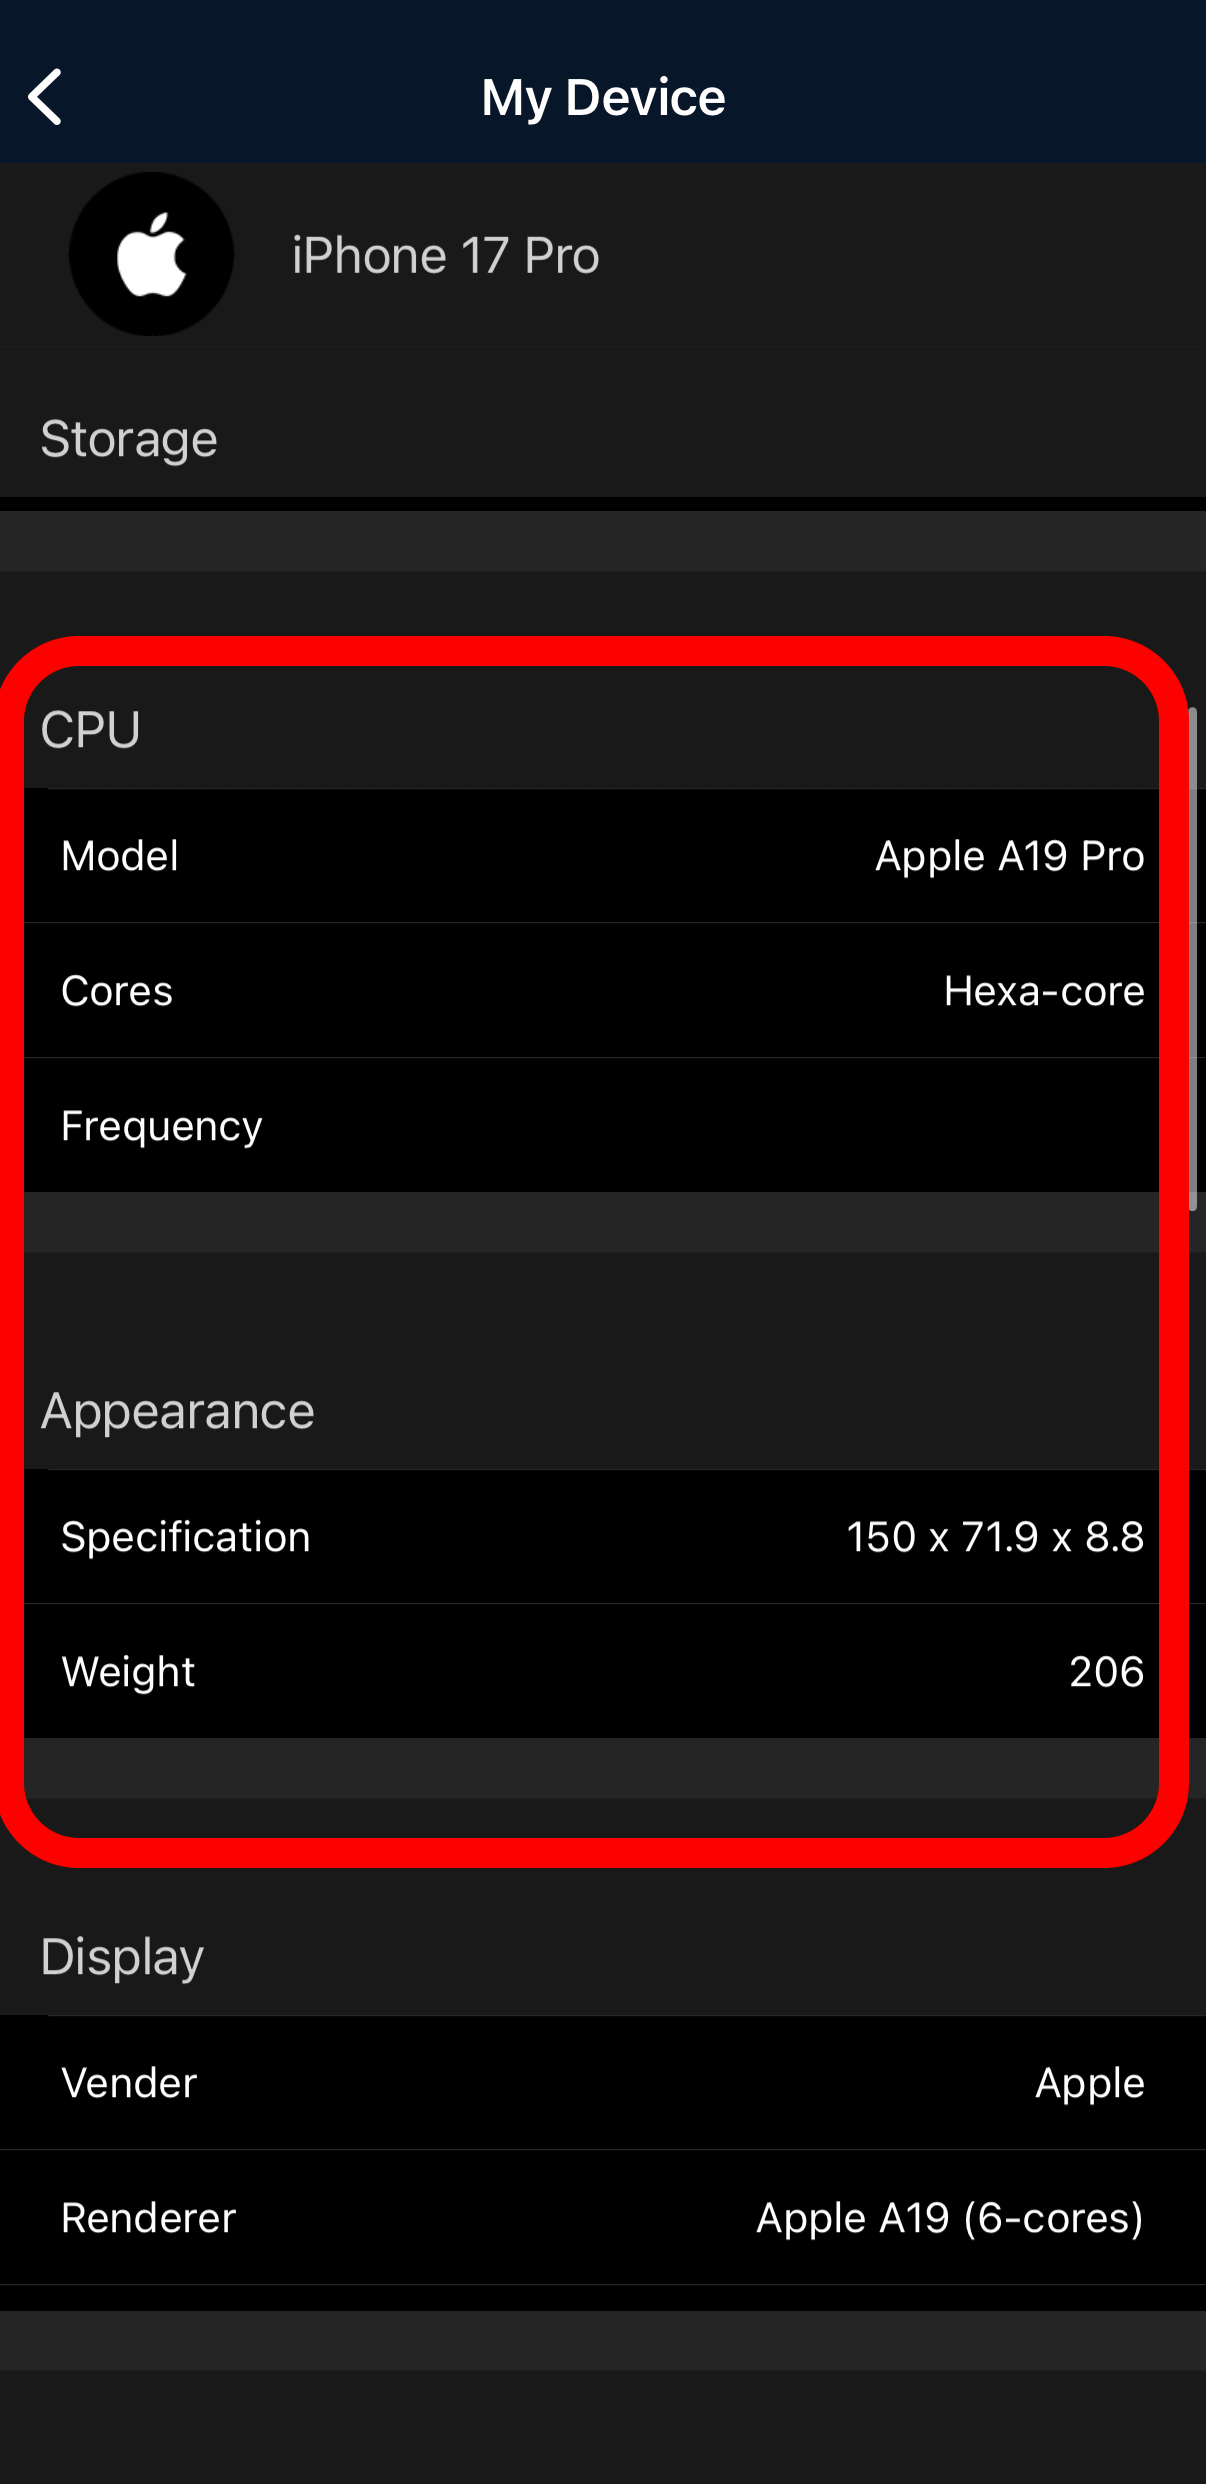
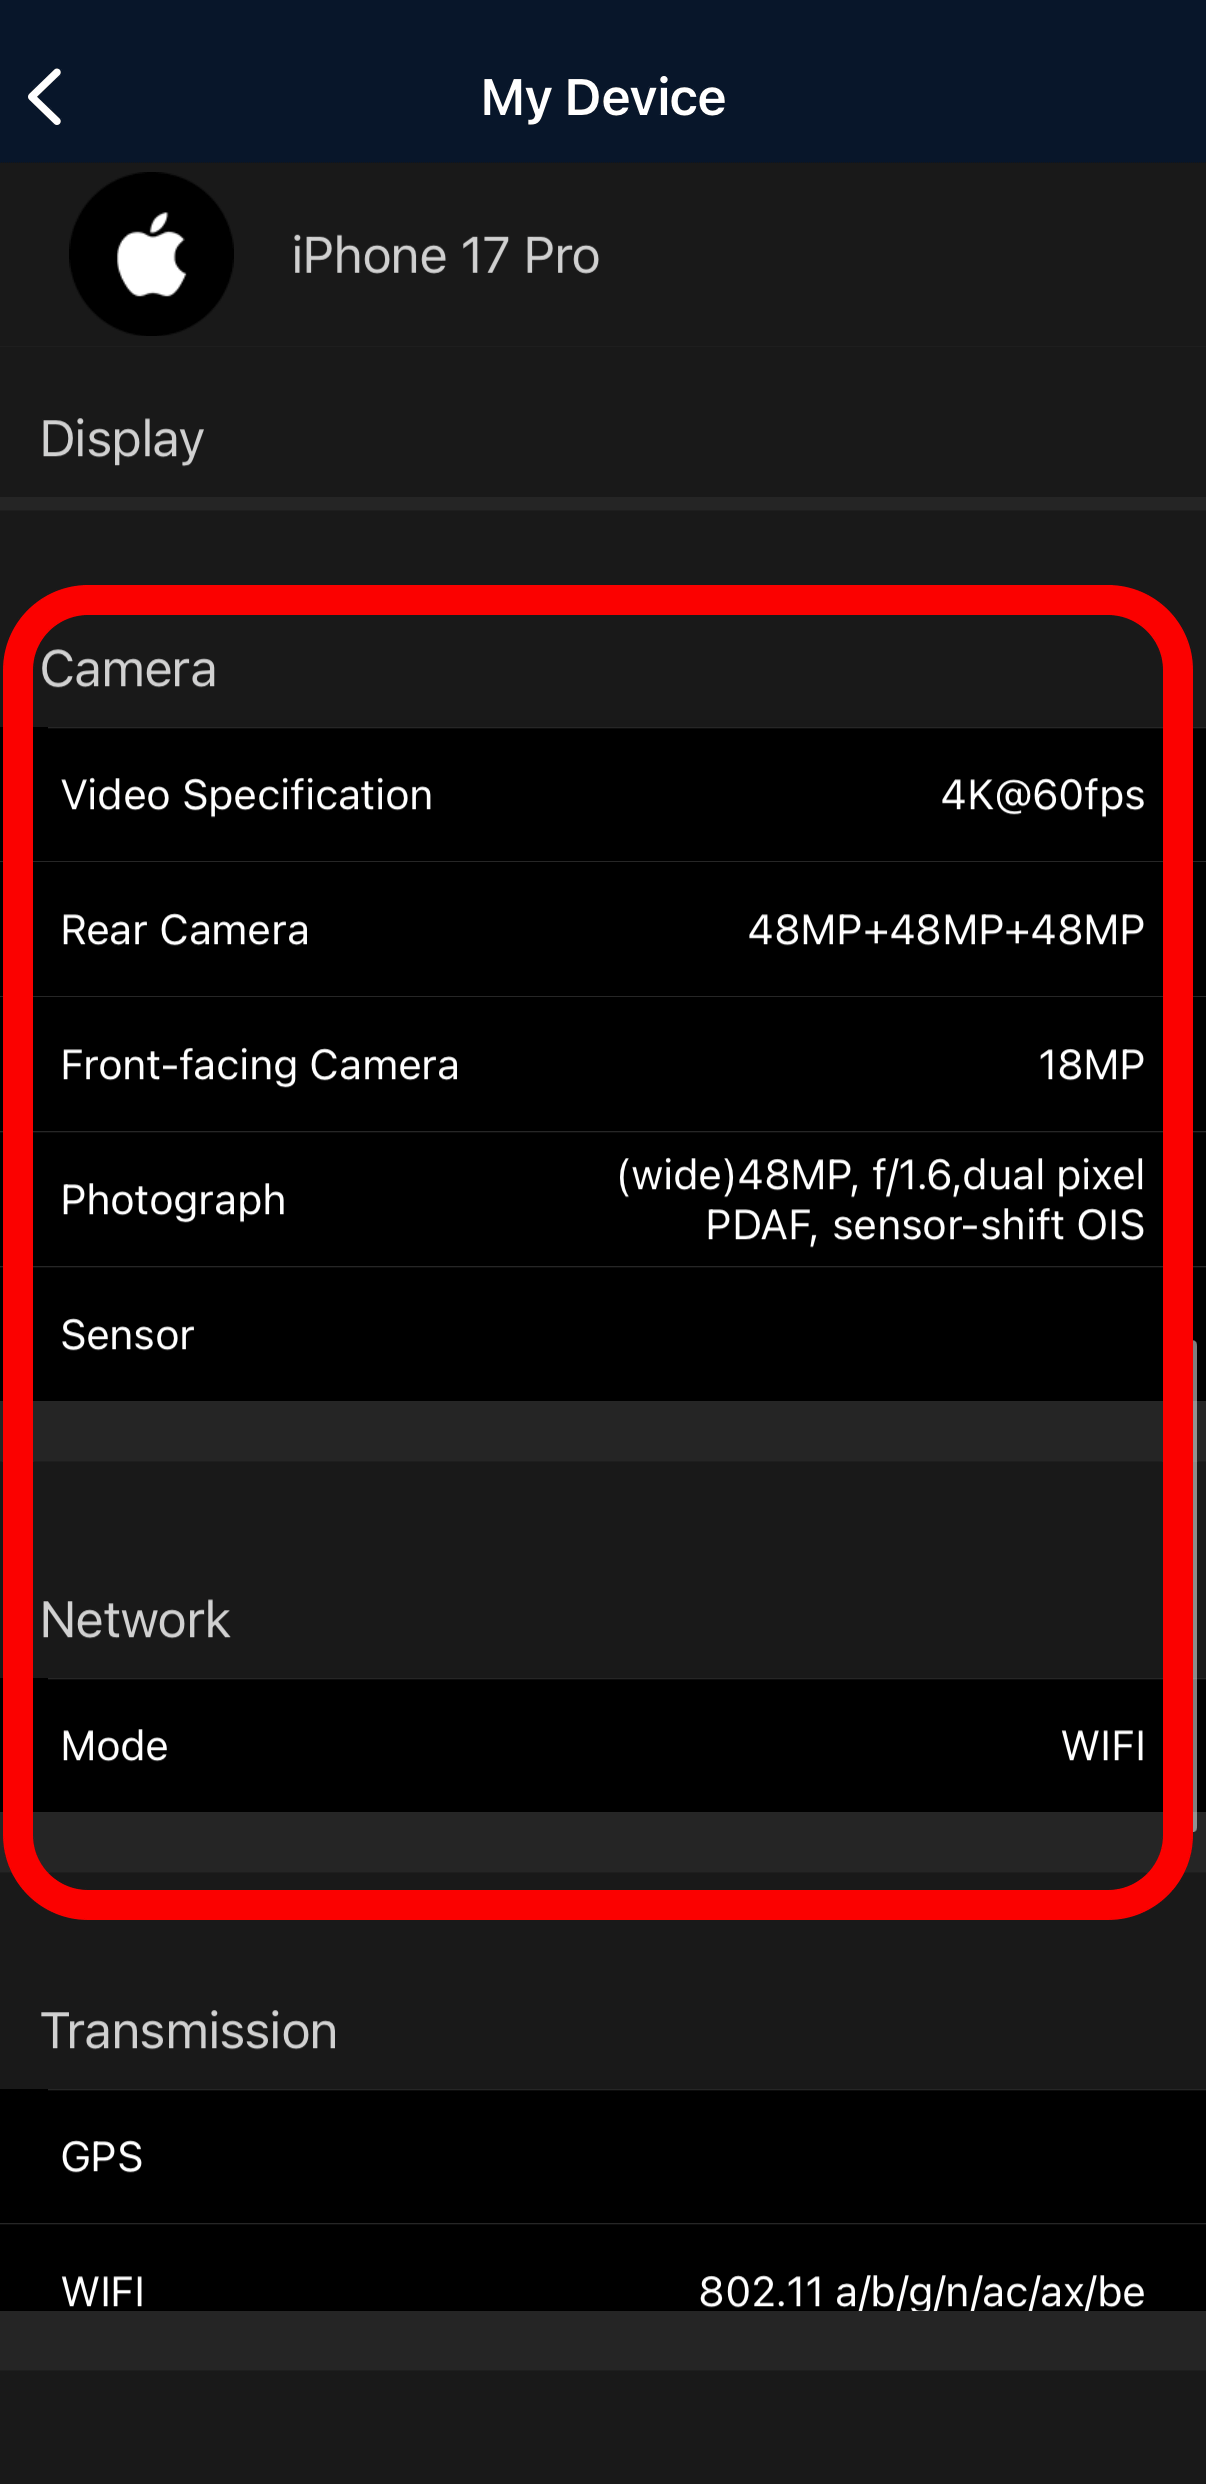
'Display' shows the manufacturer and renderer, GPU version, as well as the display size, type, resolution, pixel density, and multi-touch support.
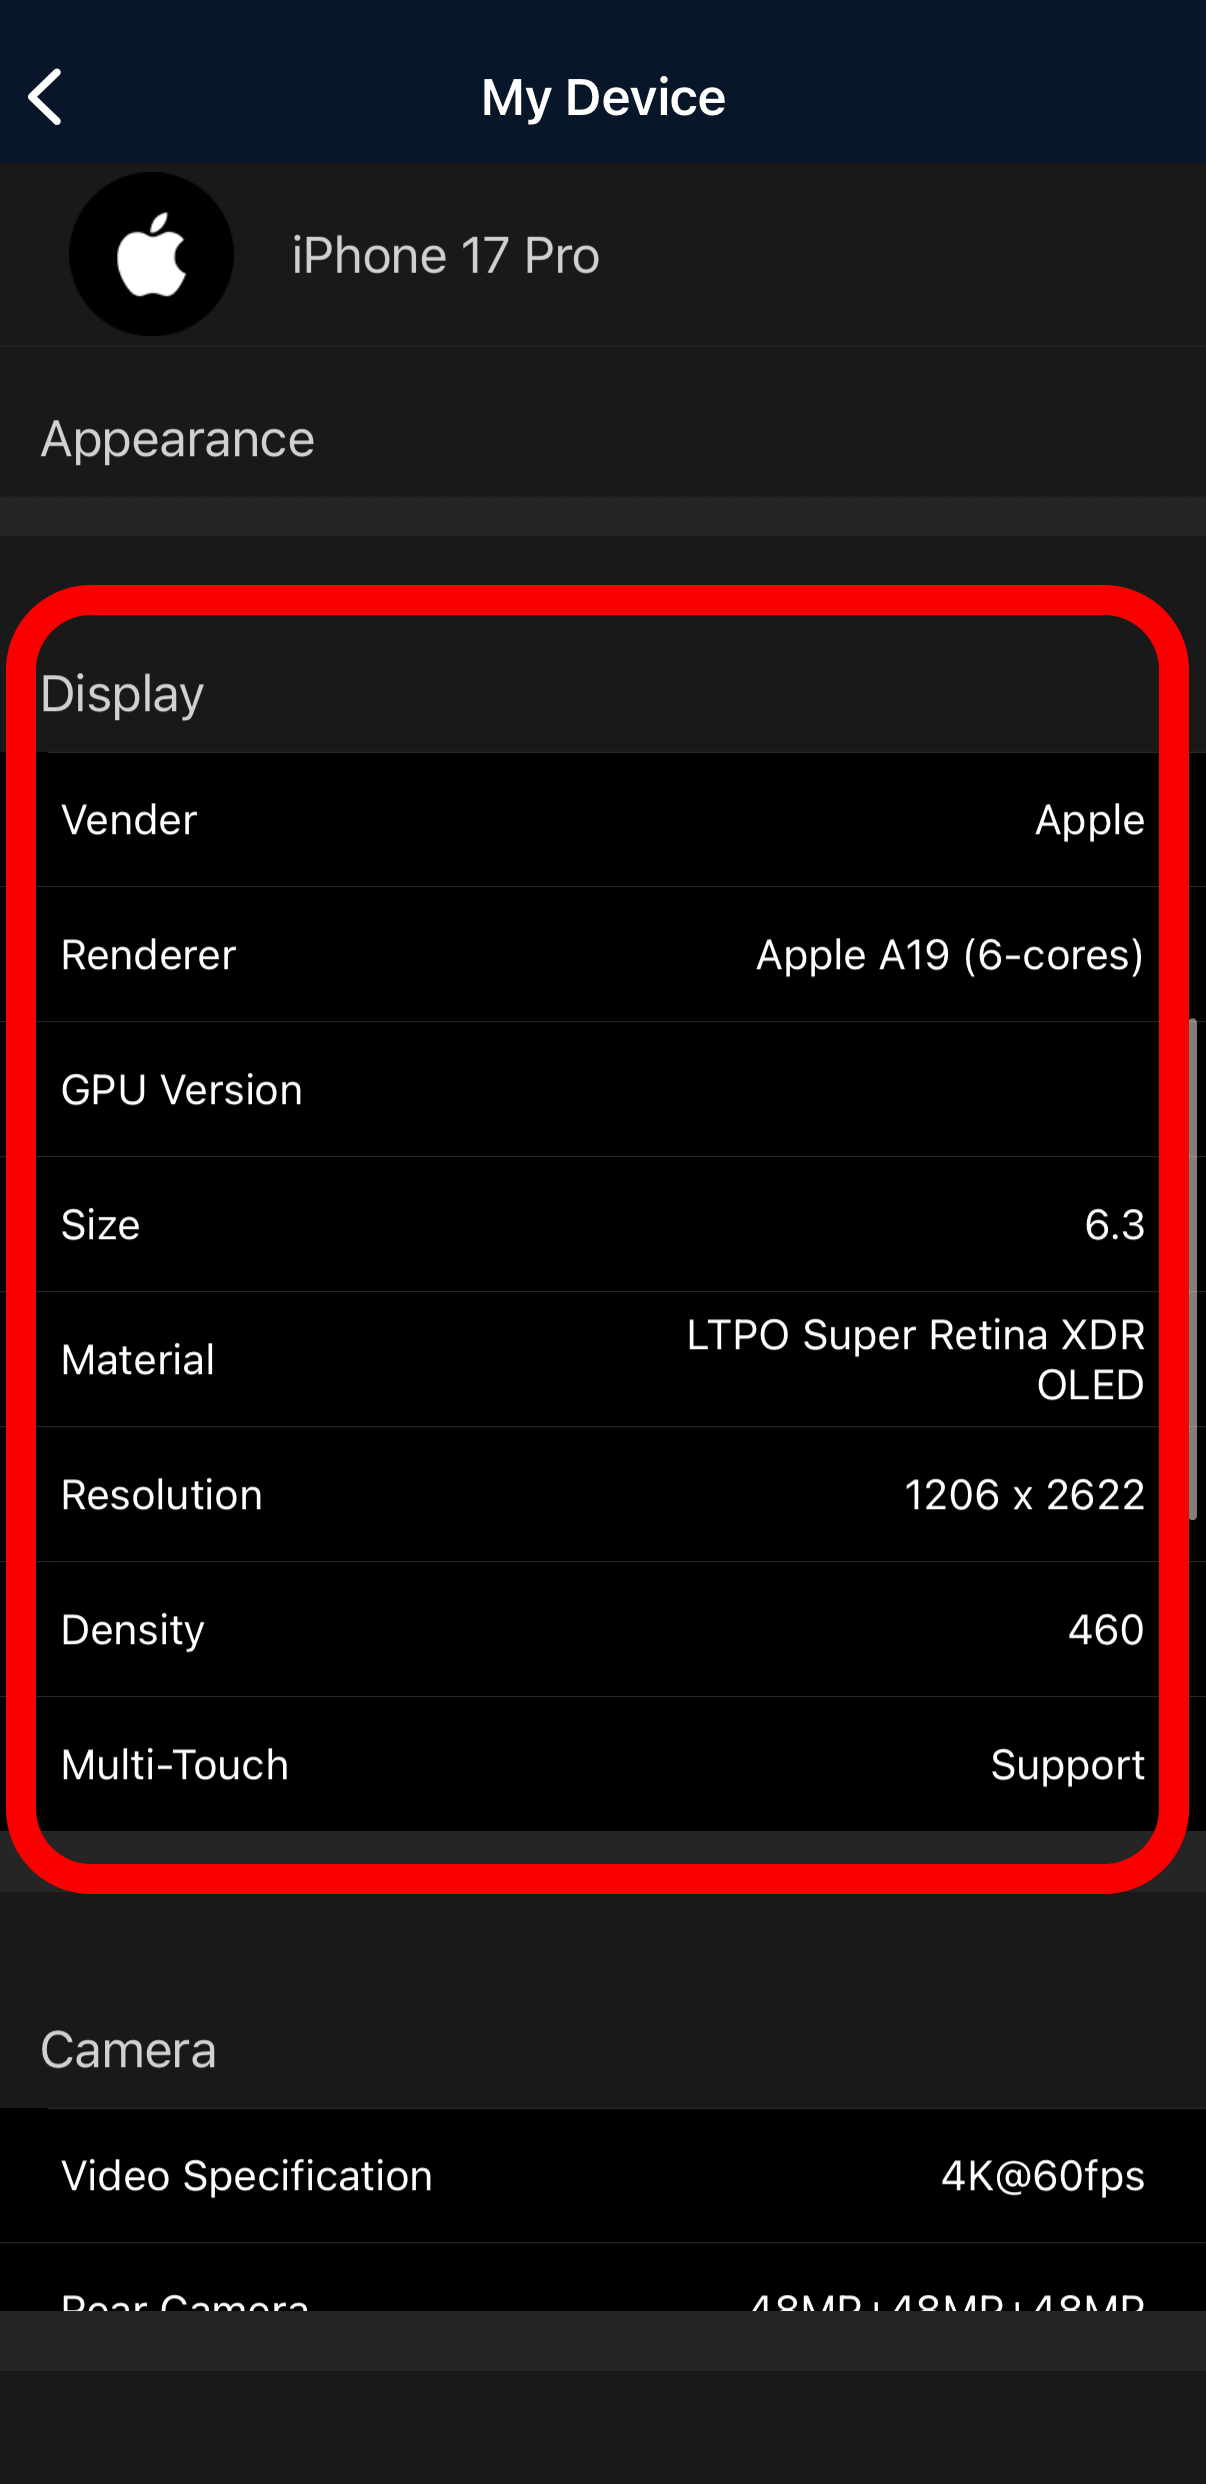
'Camera' shows the camera's video performance, etc. 'Network' shows the communication status.
'Transmission' shows wireless communication, and 'Battery' shows the percentage of remaining battery and the estimated duration (in minutes).
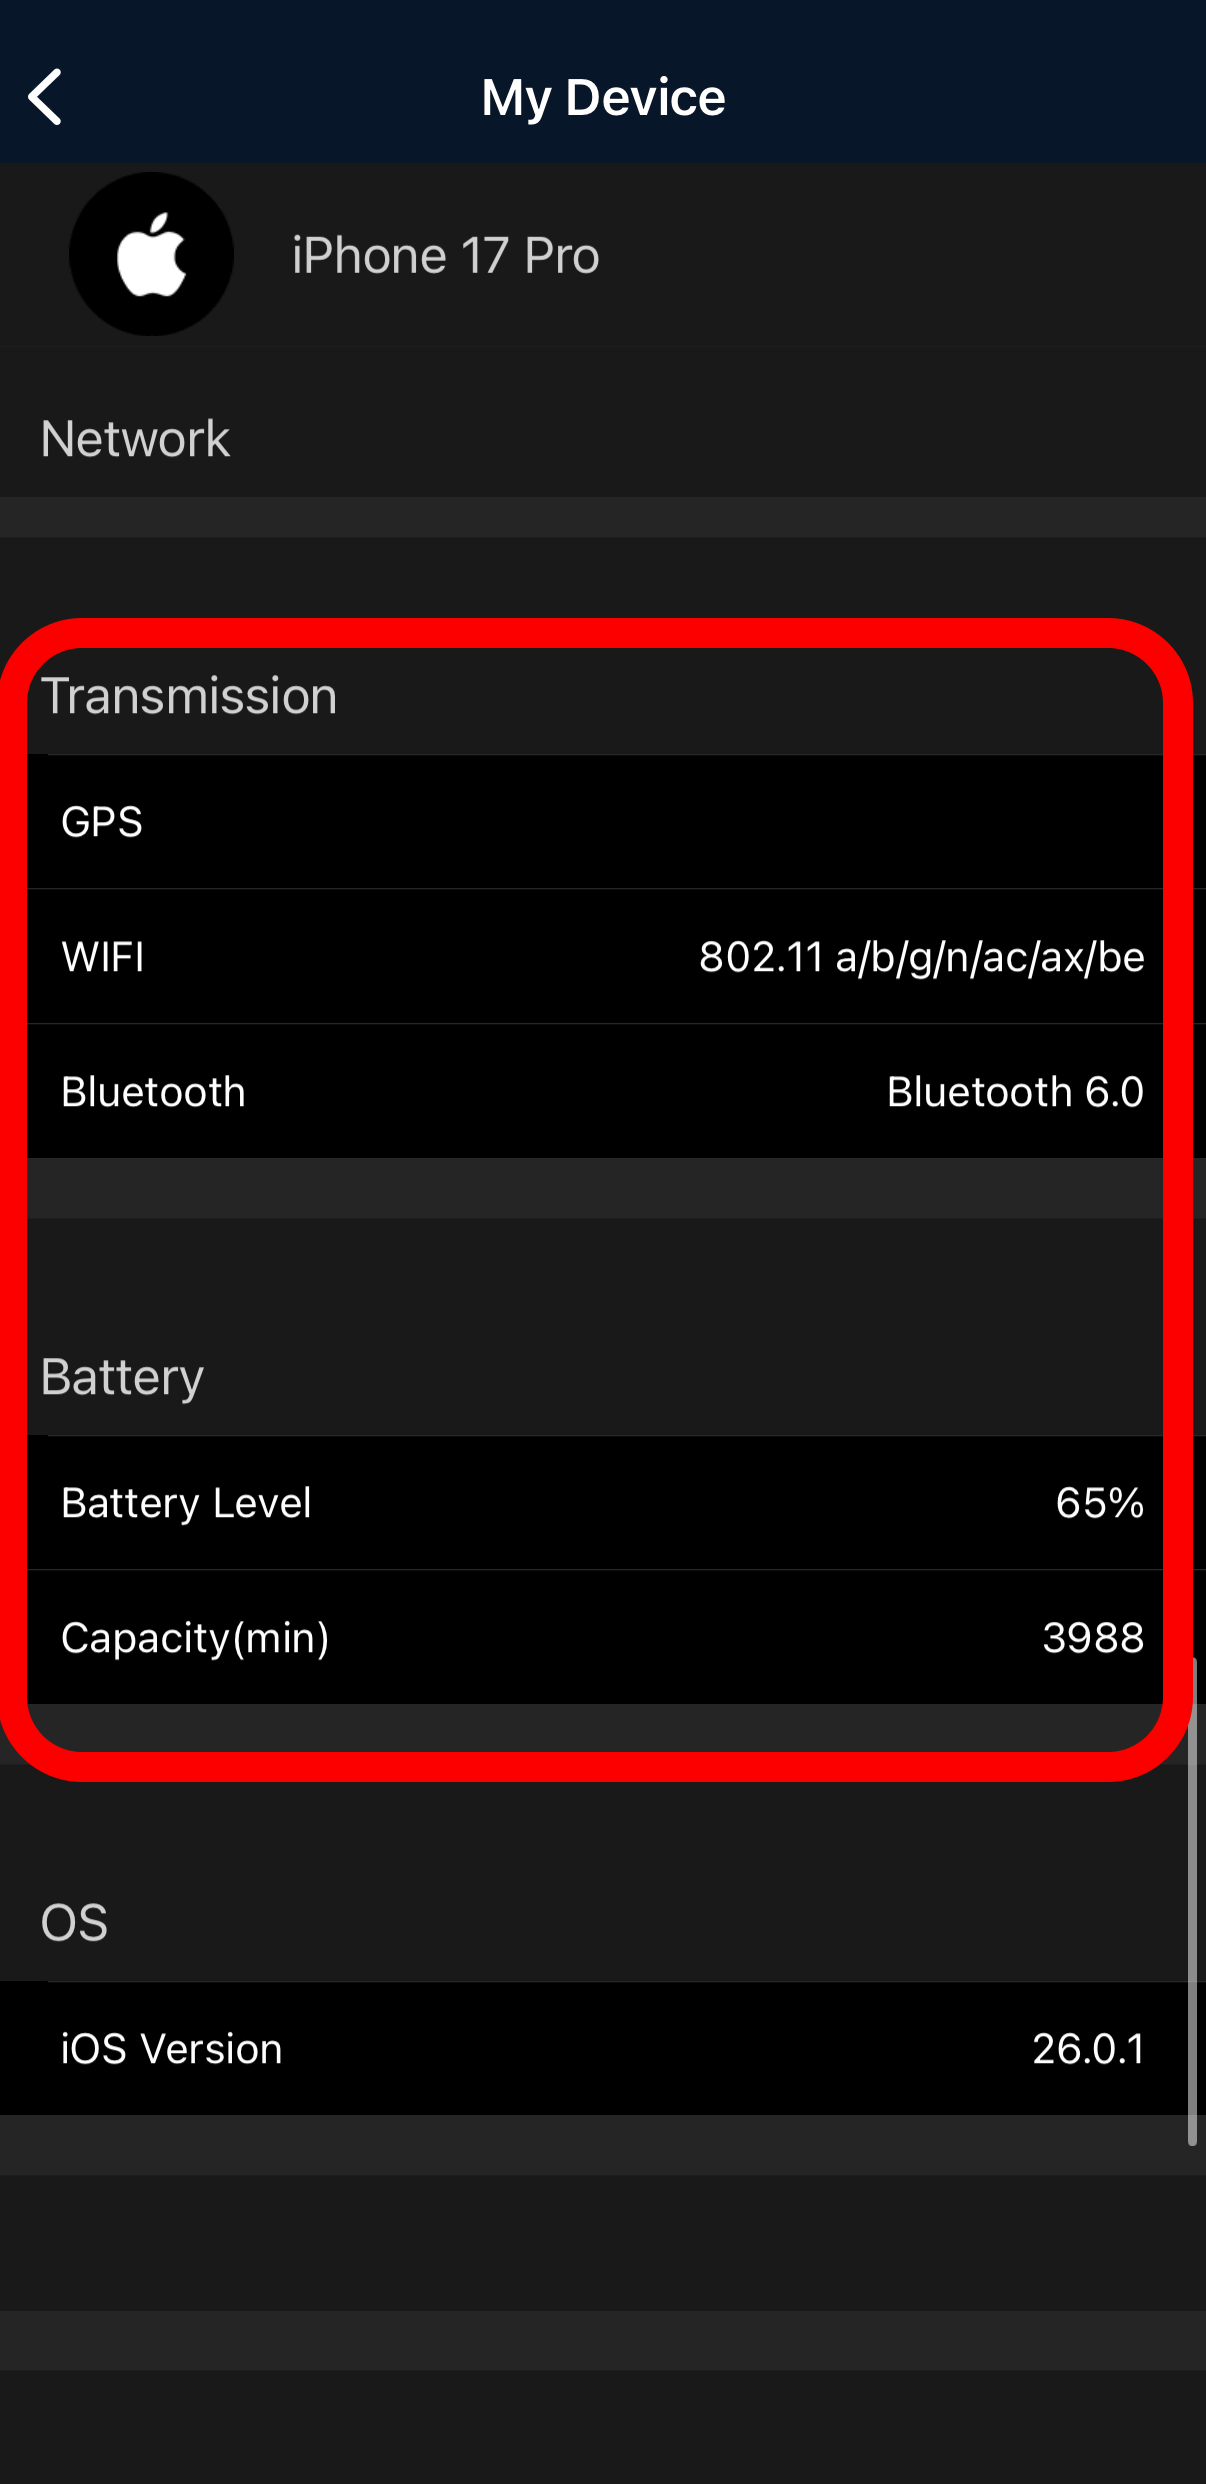
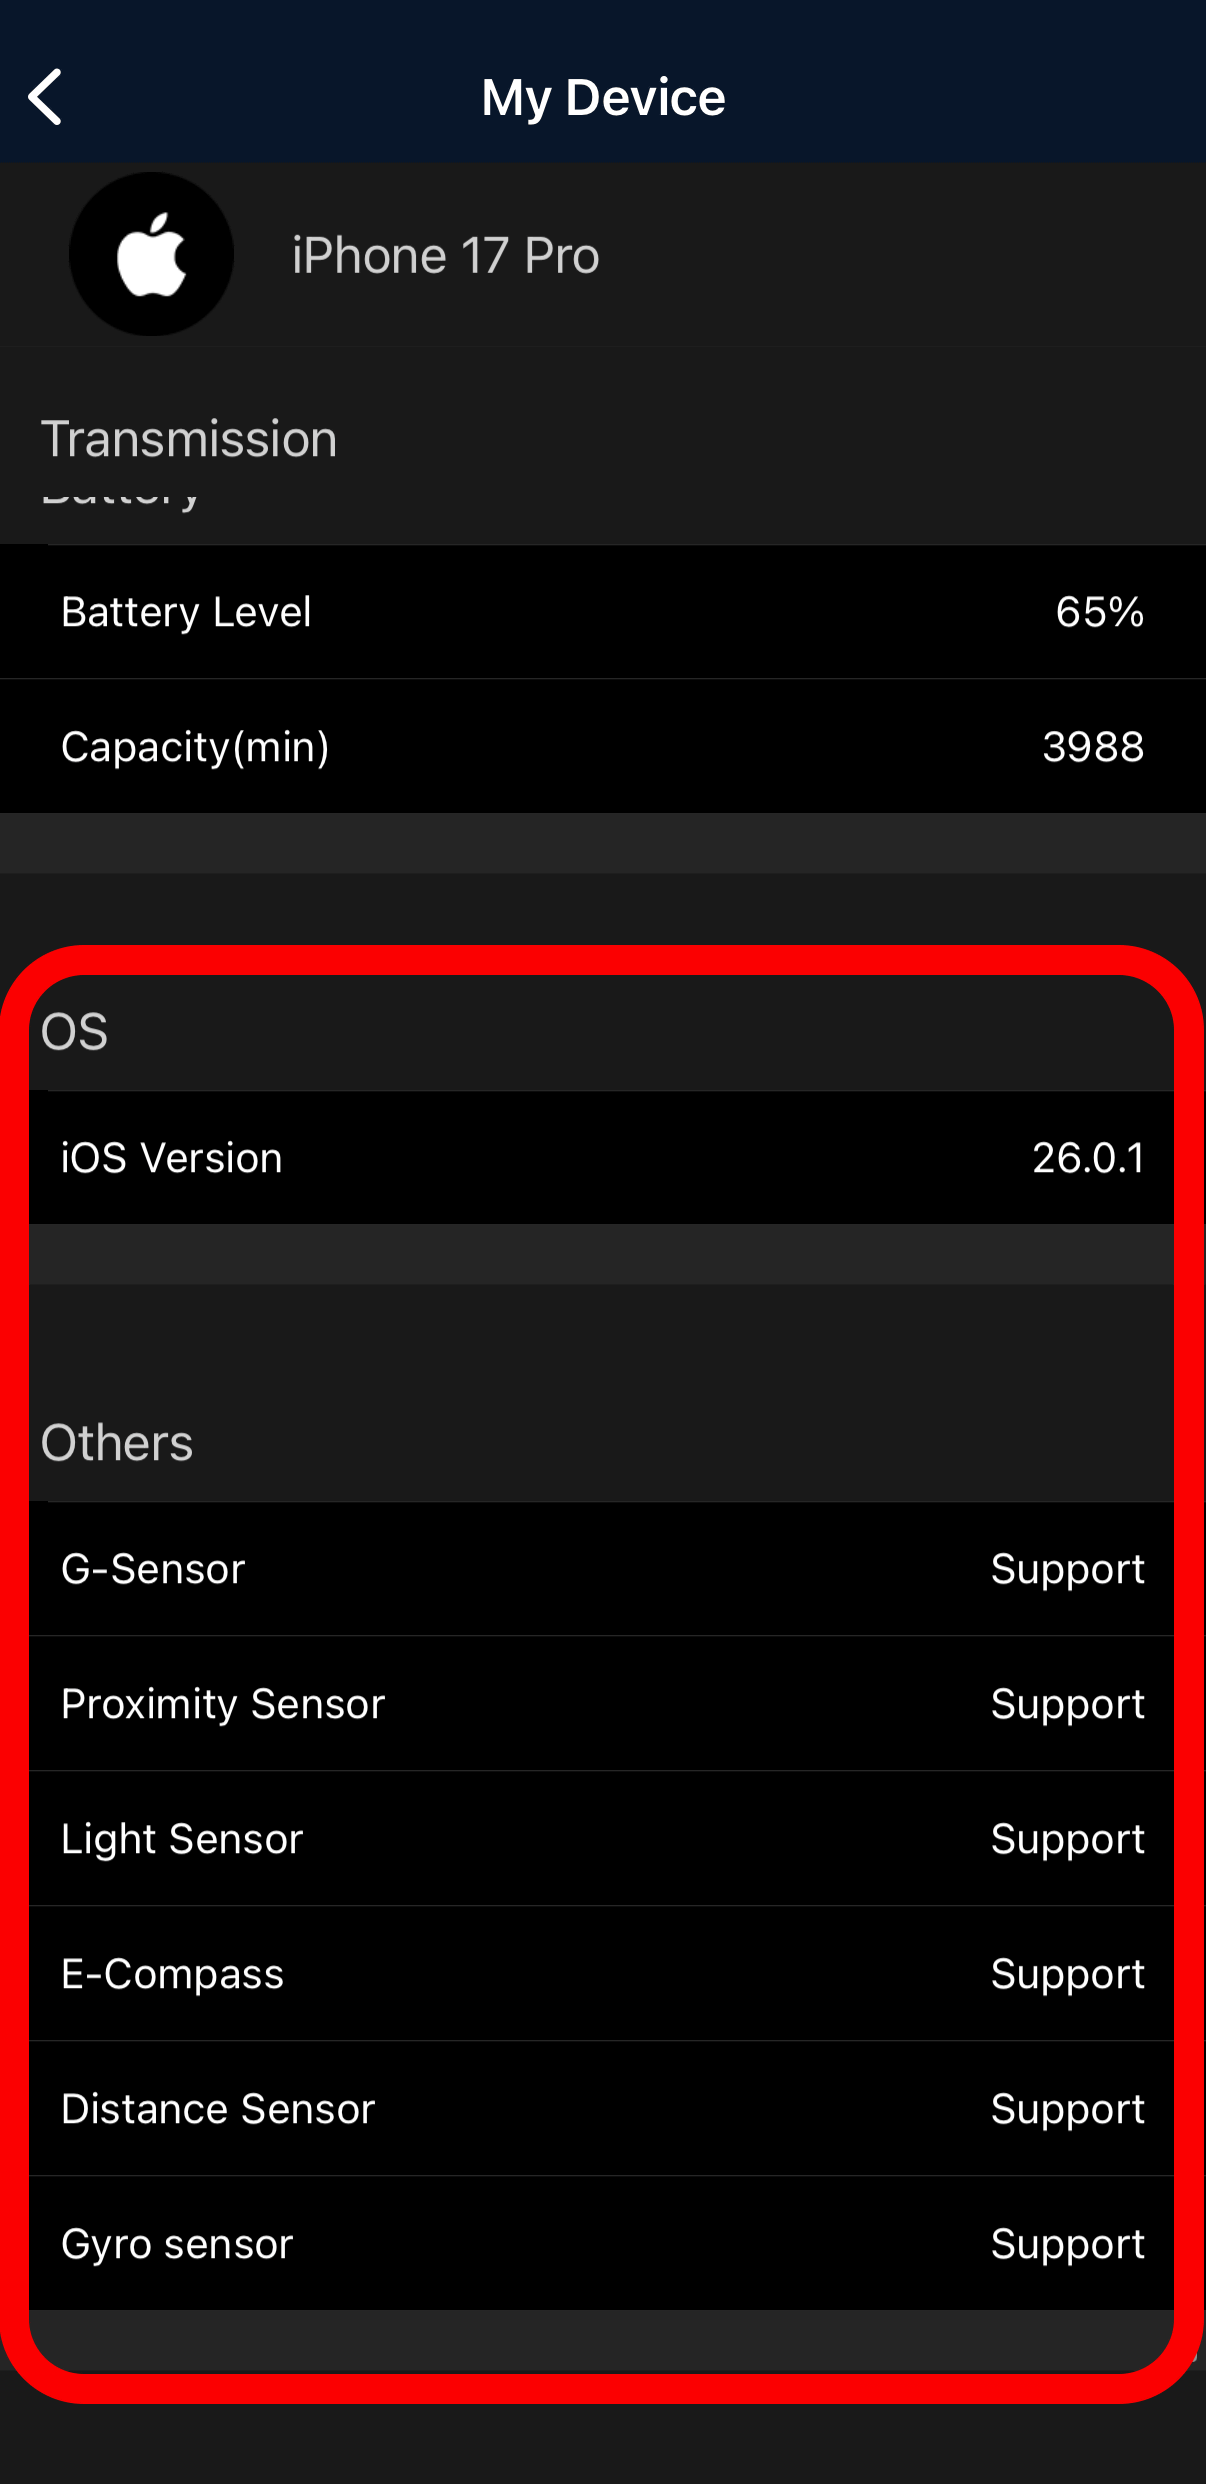
Finally, the OS version and the status of various sensors installed.
'More Features' at the bottom of the top screen contains a variety of features that allow you to check things other than the main benchmark.
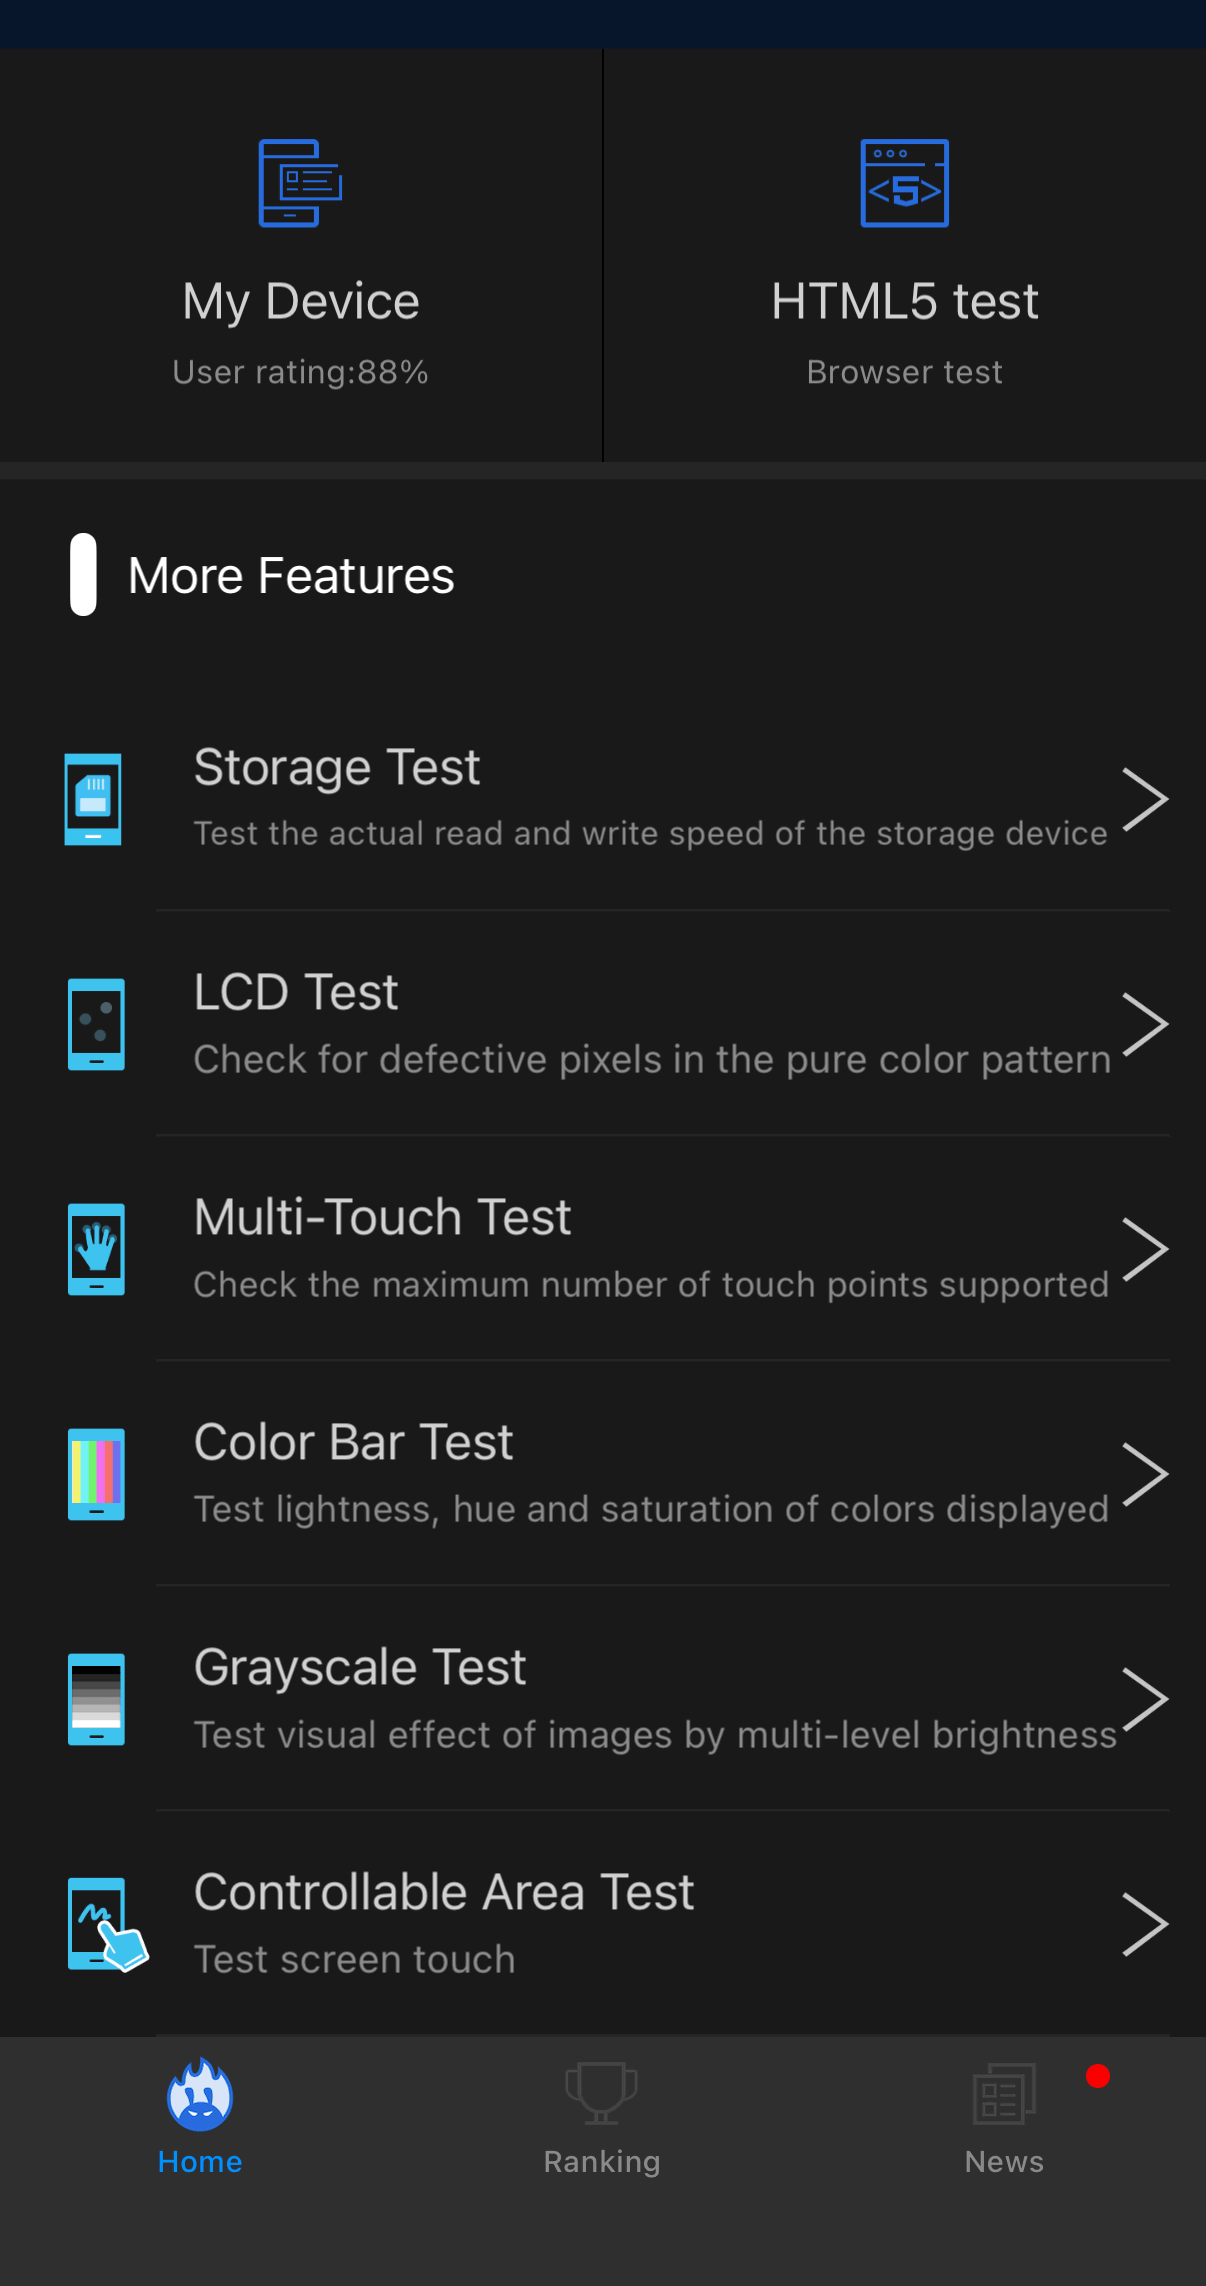
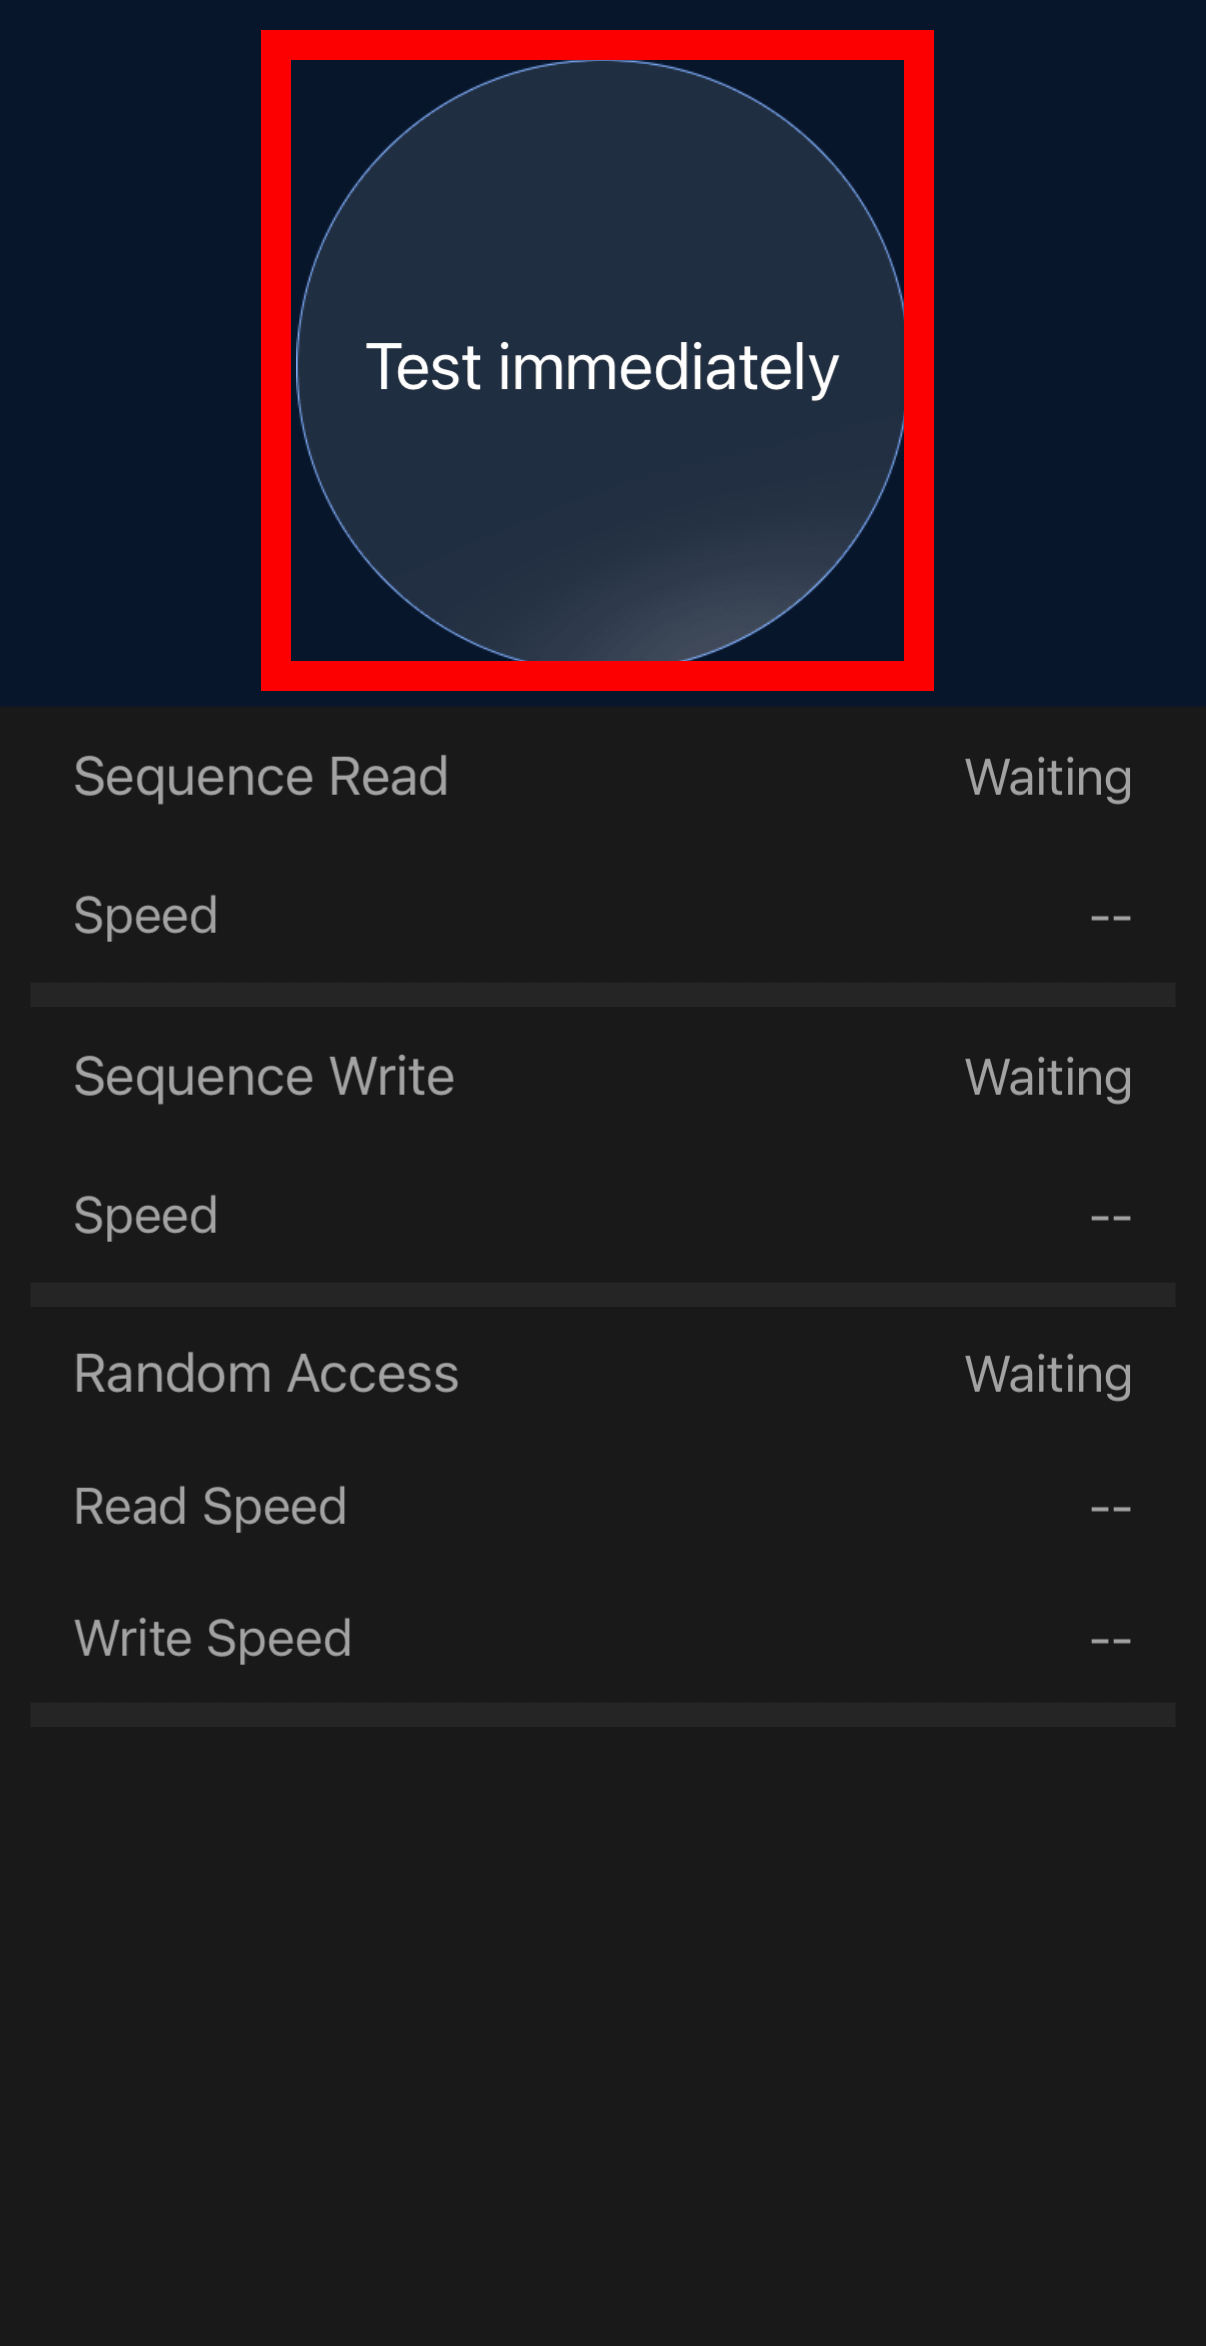
'Storage Test' can measure the sequential read/write and random access speeds to the storage. Tap 'Test immediately.'
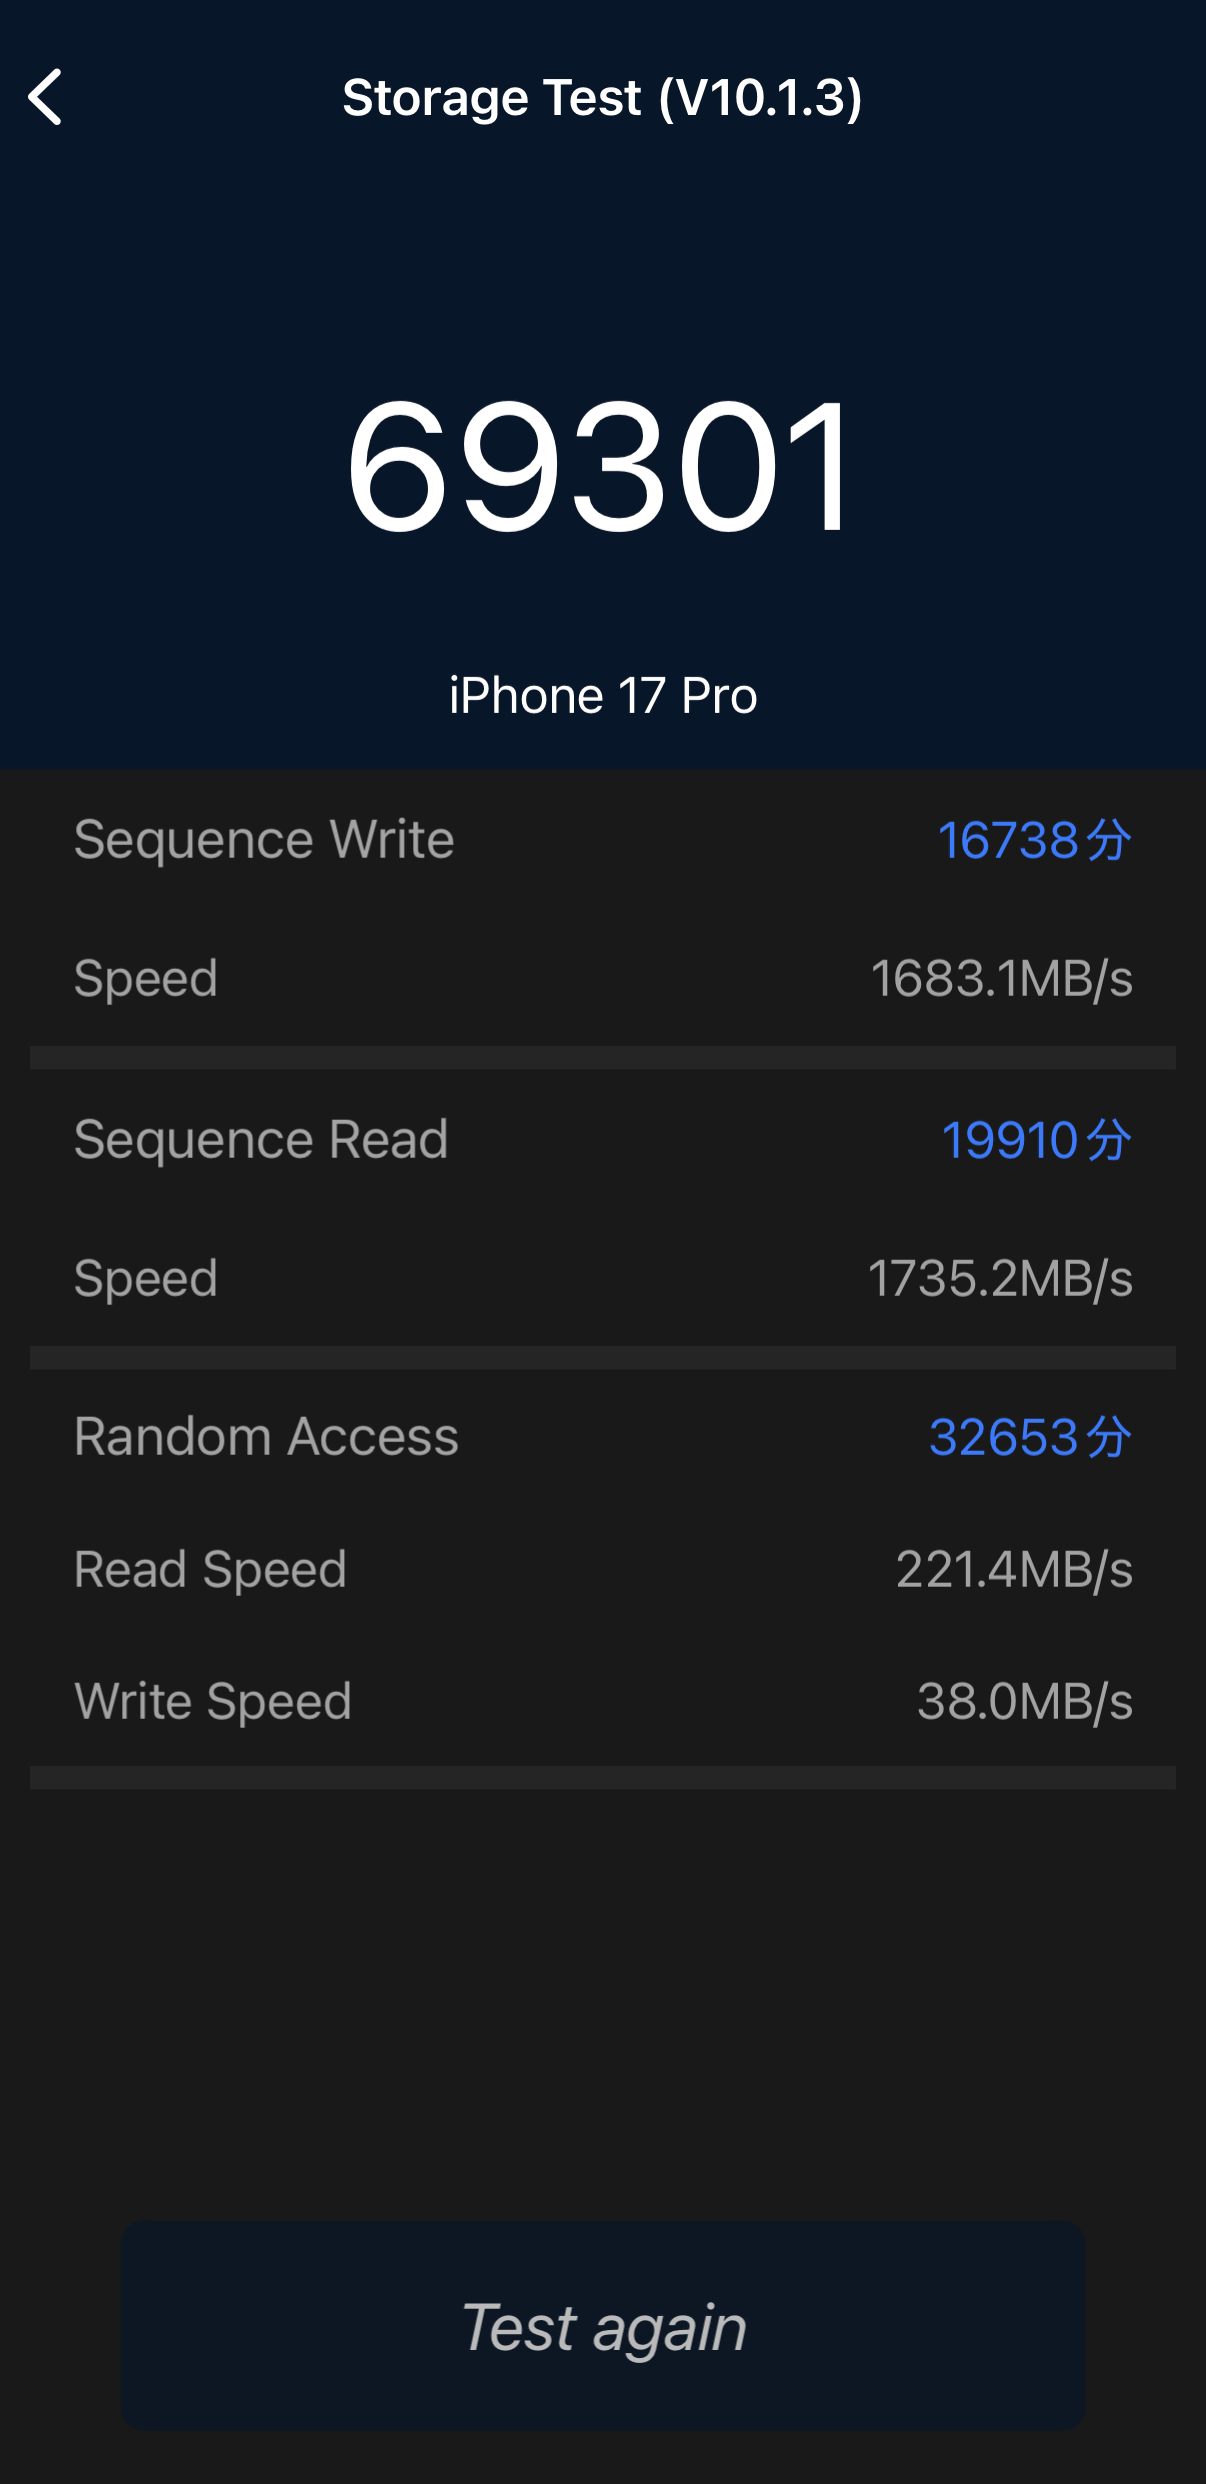
This is what it looks like for the iPhone 17 Pro.
'LCD Test' is a function that checks whether there are any missing pixels on the screen by displaying a single color pattern.

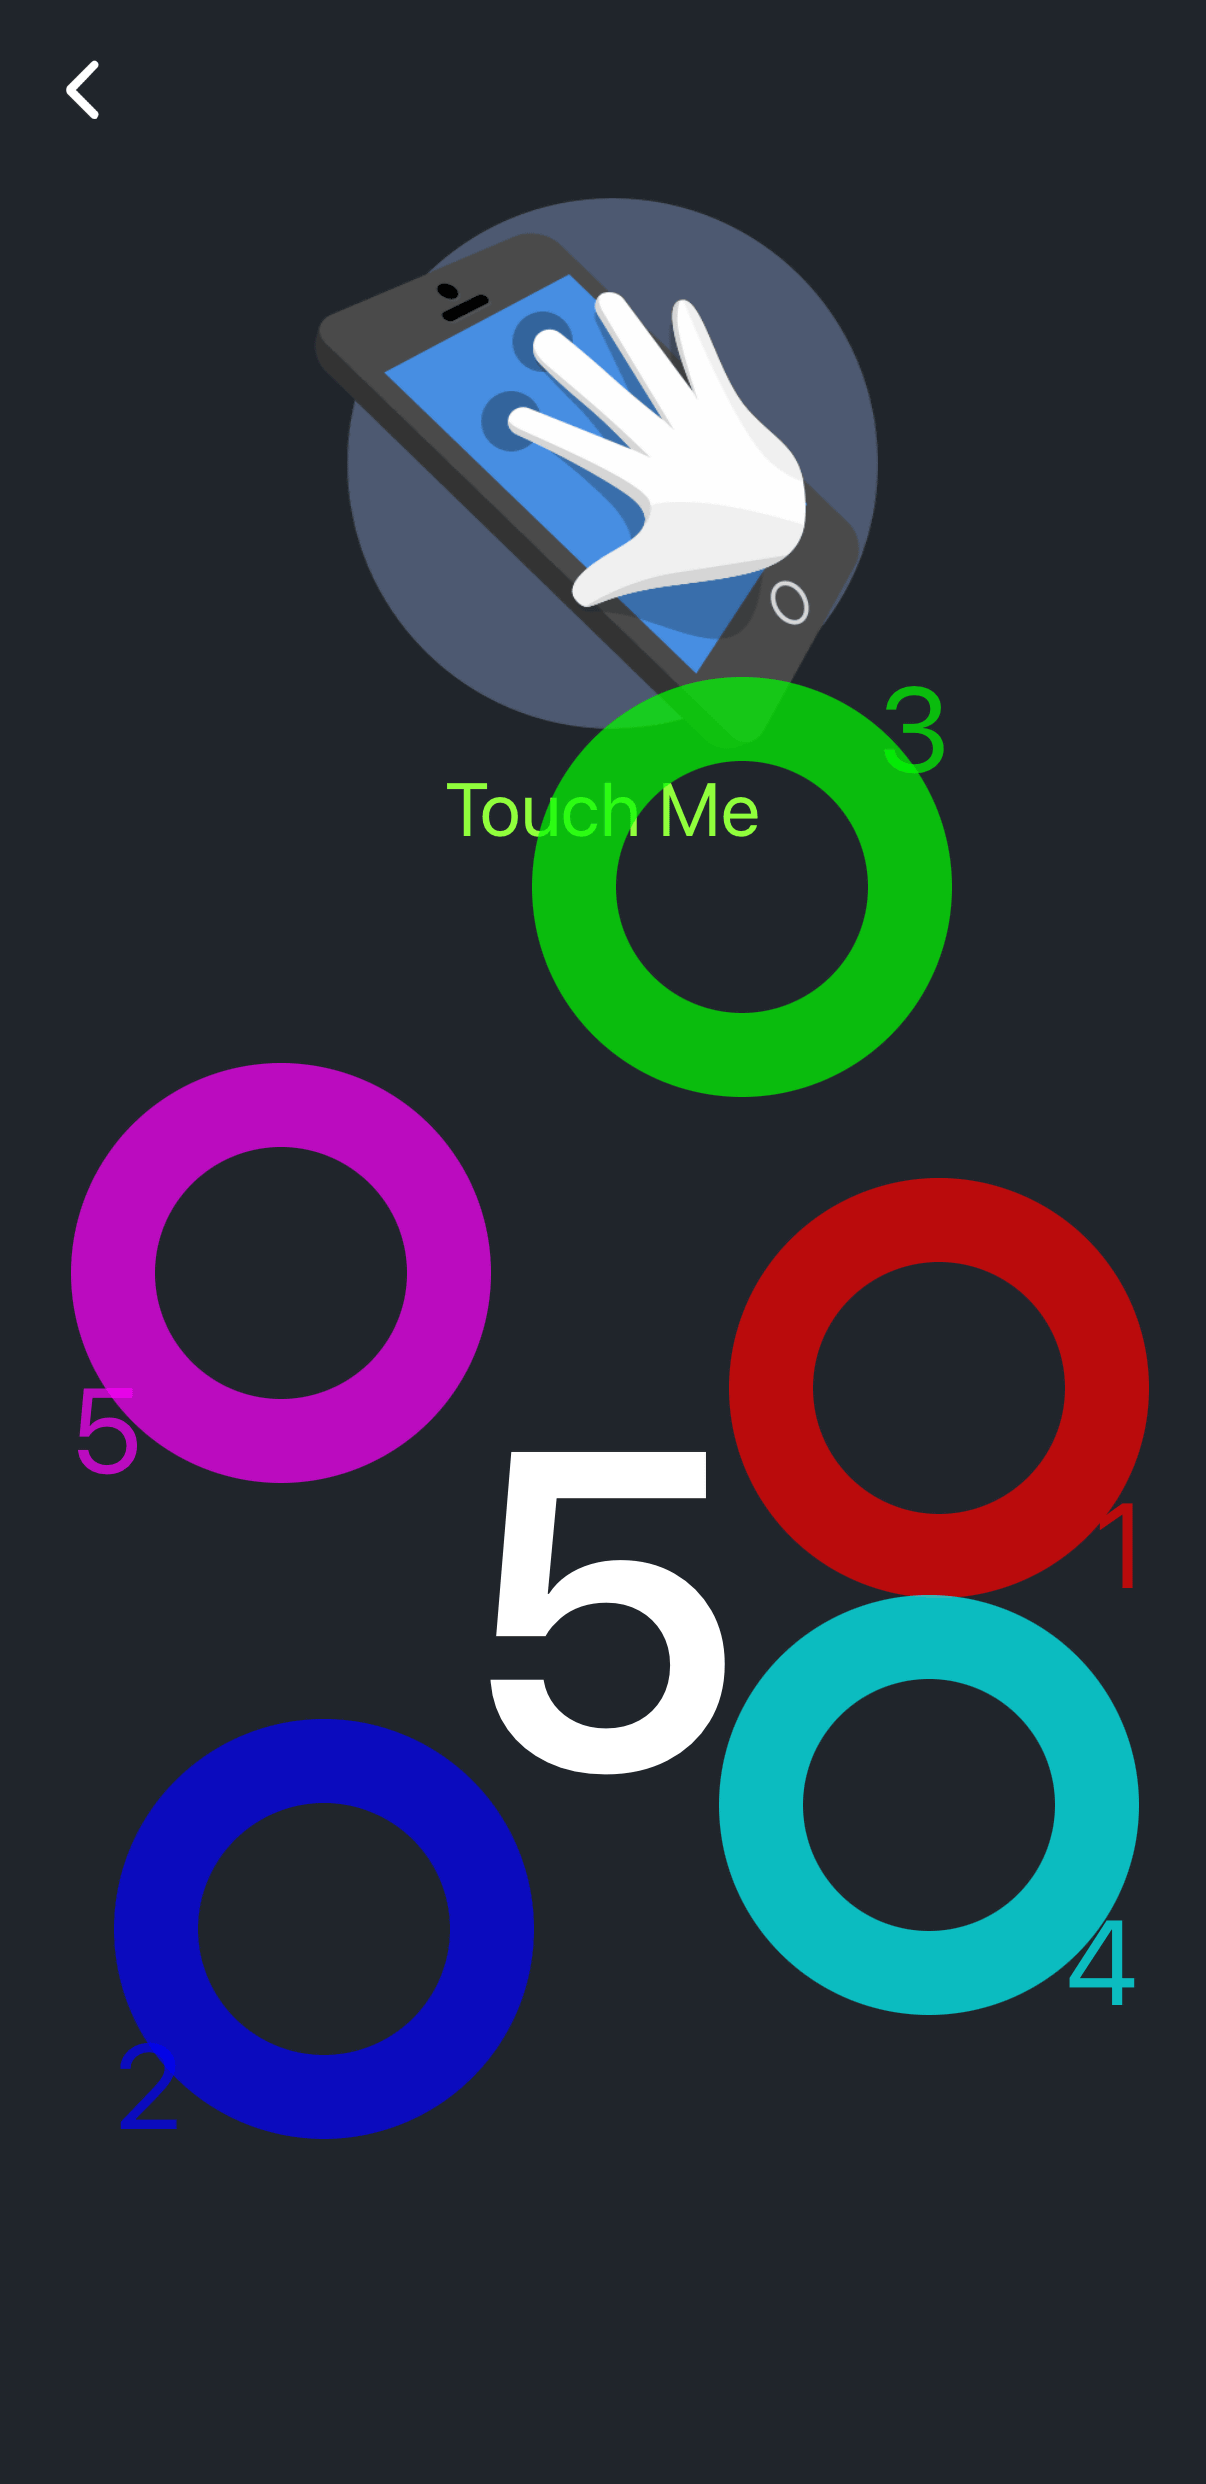
'Multi-Touch Test' is a function that checks the number of simultaneous touches on the display.
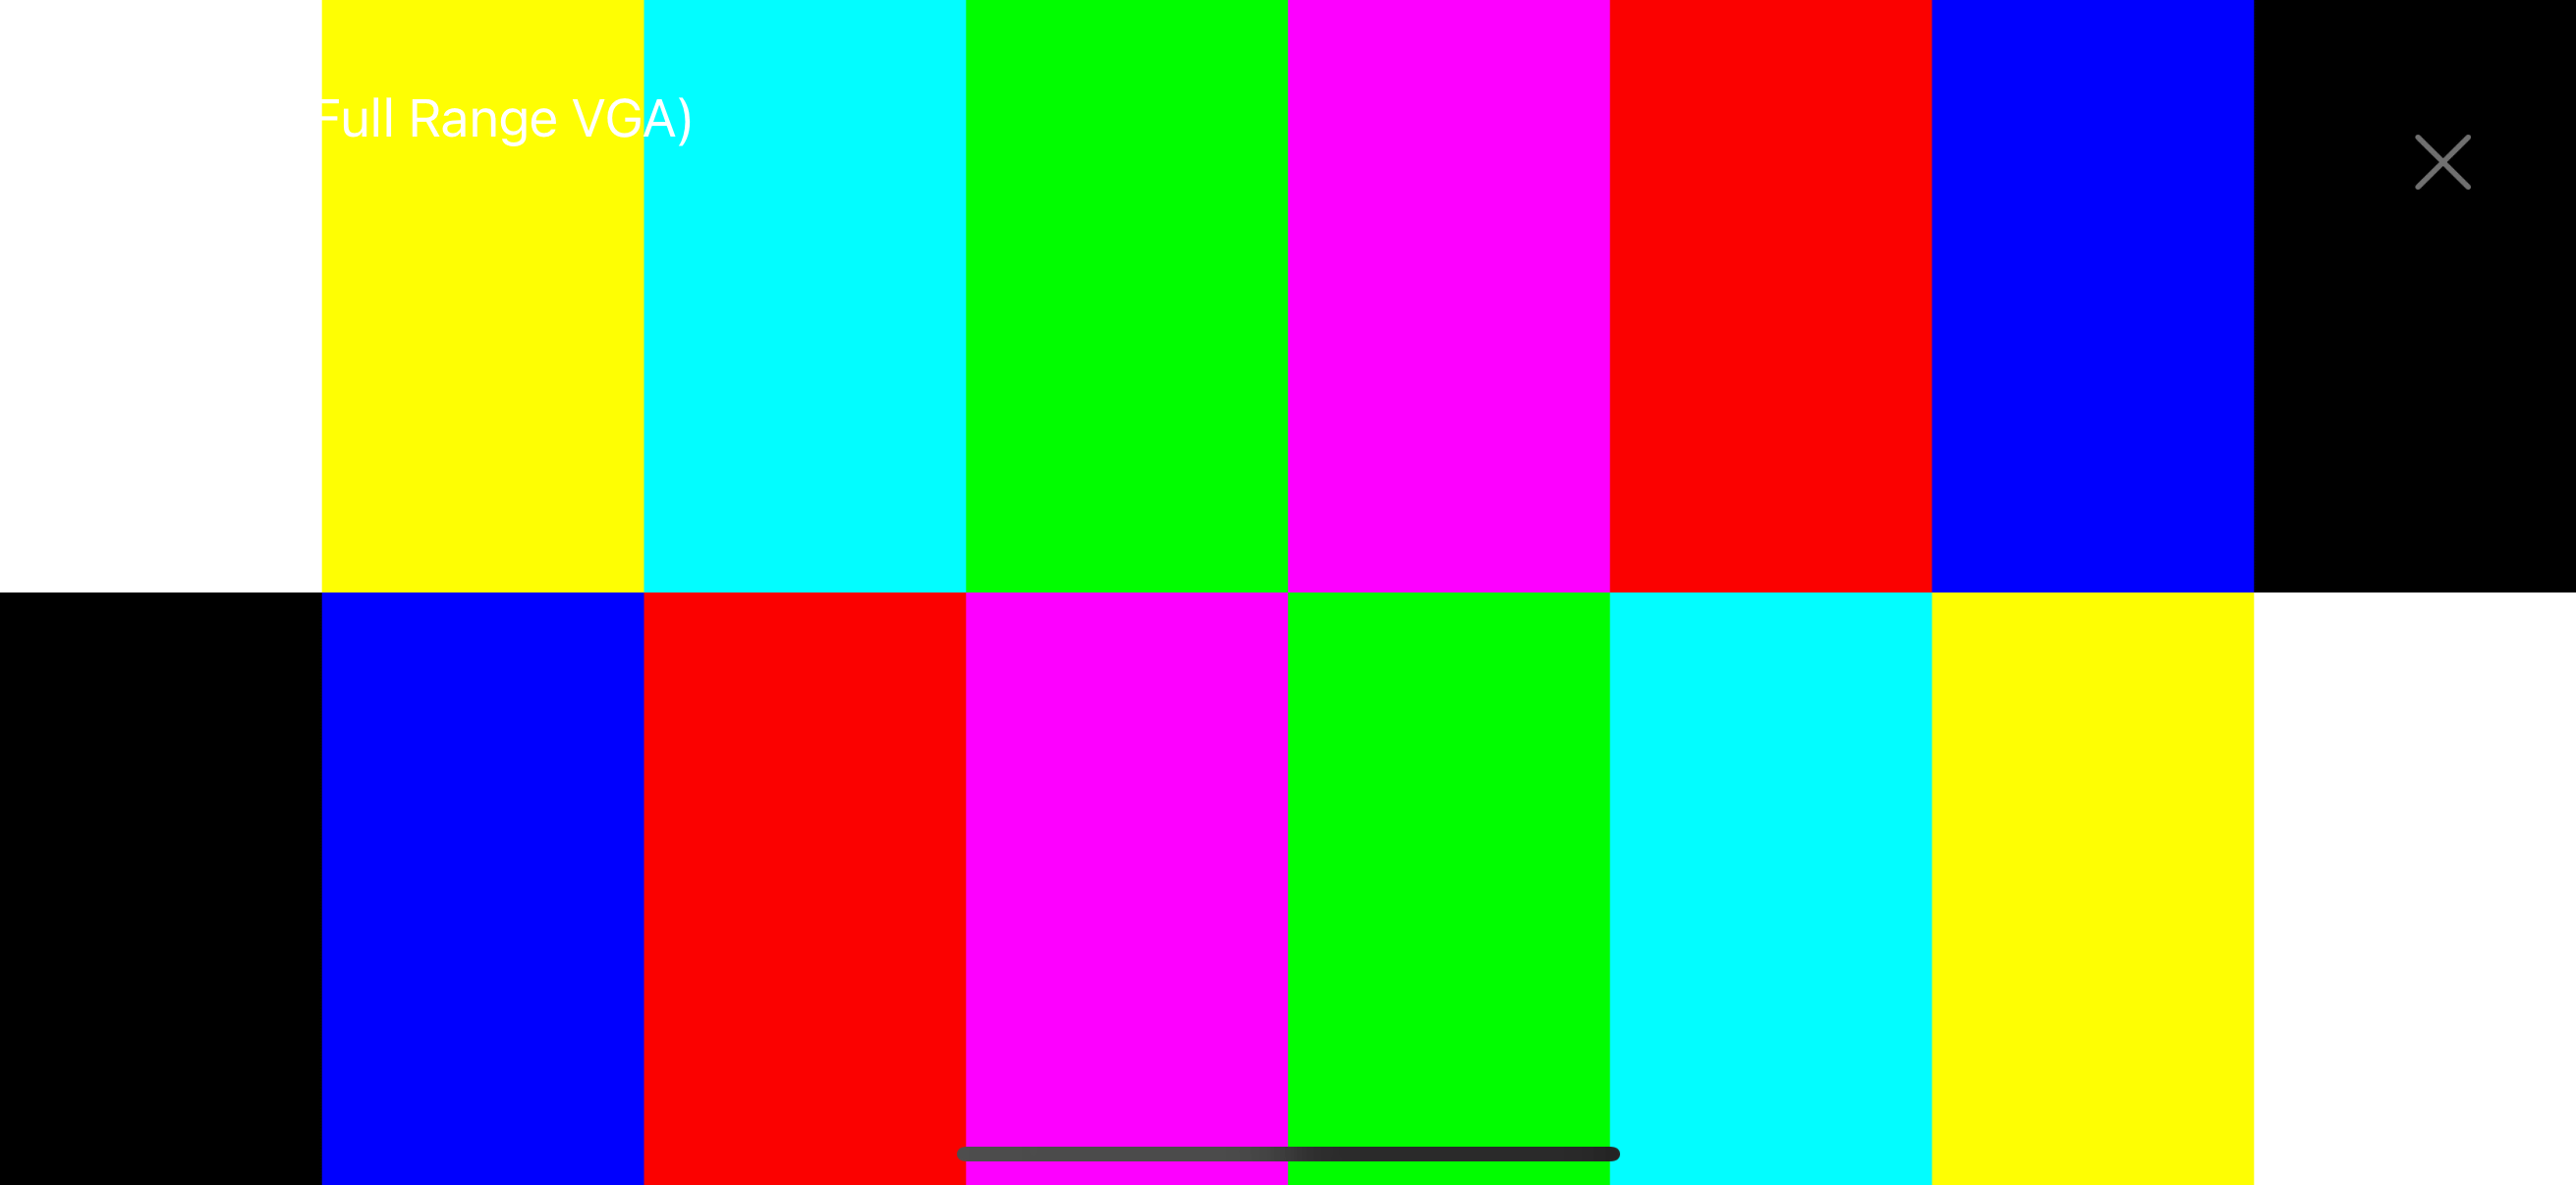
'Color Bar Test' allows you to check the brightness and color of your display.
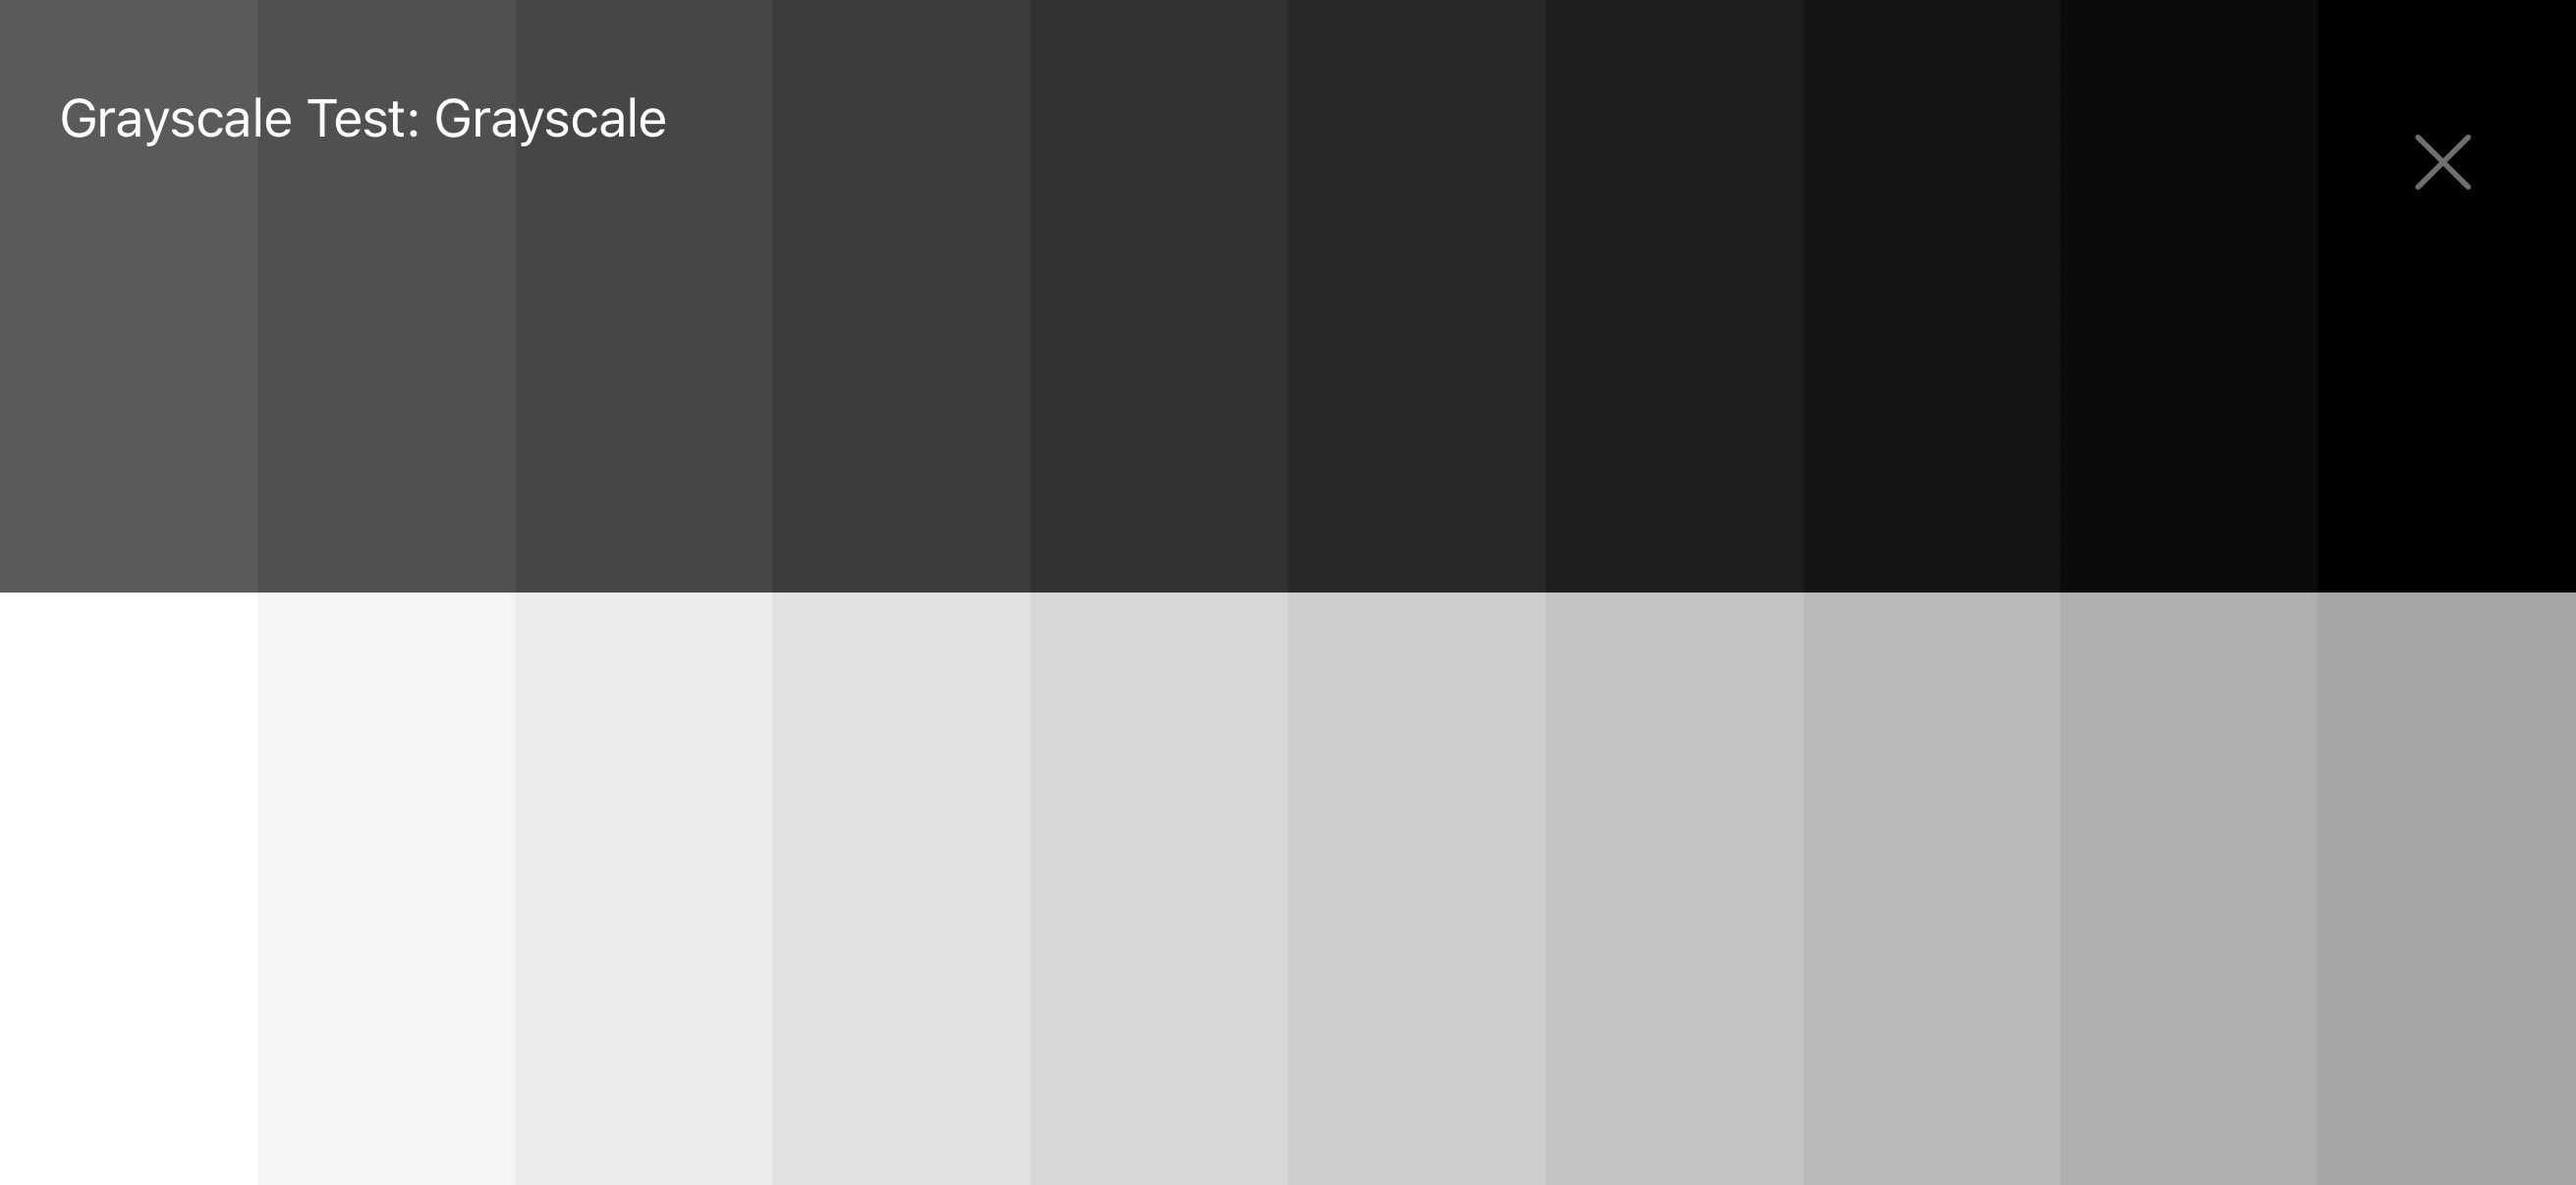
'Grayscale Test' allows you to check the contrast of your display.
The 'Controllable Area Test' allowed us to check the touch response of the display.

Next time, I'll review the even more advanced Android version. Stay tuned.
Related Posts:
in Software, Smartphone, Review, Posted by log1i_yk