Further changes have been made to the 'bathtub curve' that predicts HDD failure
Are Hard Drives Getting Better? Let's Revisit the Bathtub Curve
https://www.backblaze.com/blog/are-hard-drives-getting-better-lets-revisit-the-bathtub-curve/
The conventional wisdom was that the failure rate of HDDs was high when they first began operation because initial defects were first detected, then gradually stabilized as the drive became more stable, and then as the drive was used for longer periods of time, wear-out failures began to occur and the failure rate rose again, creating a U-shaped 'bathtub curve.'
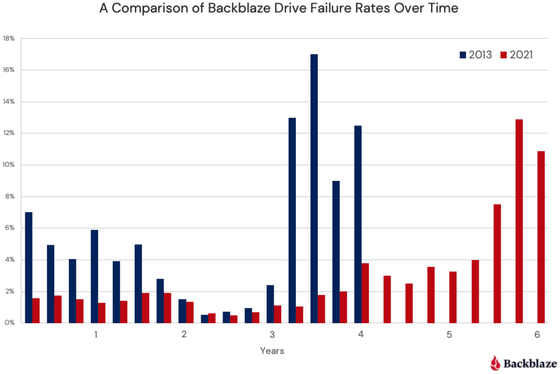
However, cloud storage service provider Backblaze conducted an analysis based on data from a large number of HDDs it operates and reported that the bathtub curve has changed in 2021. Backblaze noted that wear-out failures are occurring later than before, and that the 'width of the bathtub has widened.'
Changes in the 'bathtub curve' showing the relationship between HDD and SSD usage time and failure rate - GIGAZINE
Four years after their 2021 report, Backblaze has released a new report. In this report, Backblaze describes the bathtub curve as 'more like an ankle-high wall at the entrance to a shower stall than a bathtub leak.'
The reason for this is that the performance of storage products has improved and their lifespans have extended, so the neat story that once defined the 'bathtub' model - 'initial failure,' 'stable mid-life,' and 'gradual decline' - no longer applies.
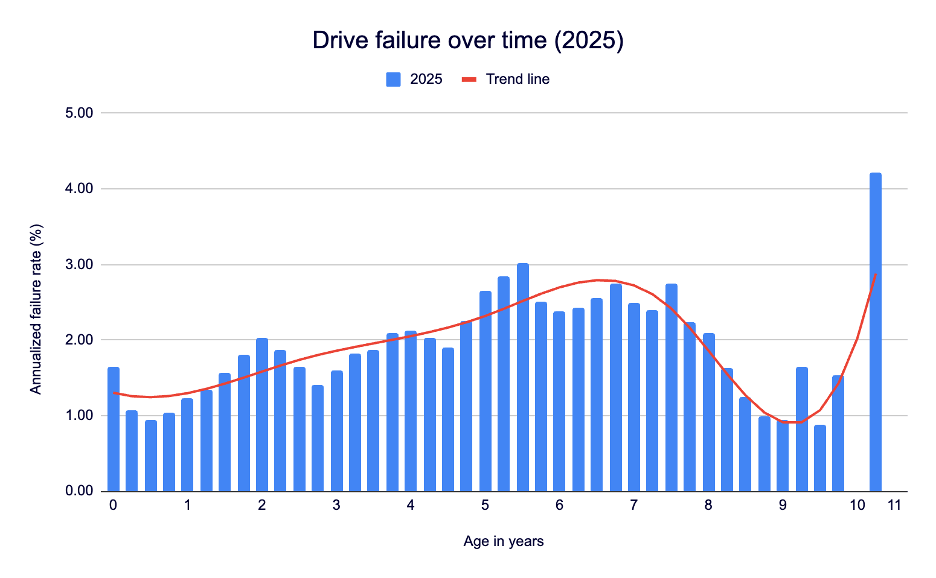
Backblaze's failure rate graph for 2025 looks like this. The horizontal axis shows time, and the vertical axis shows the failure rate. As Backblaze analyzed, there will not be many 'initial defects,' and there will be no 'stable mid-term' after that.
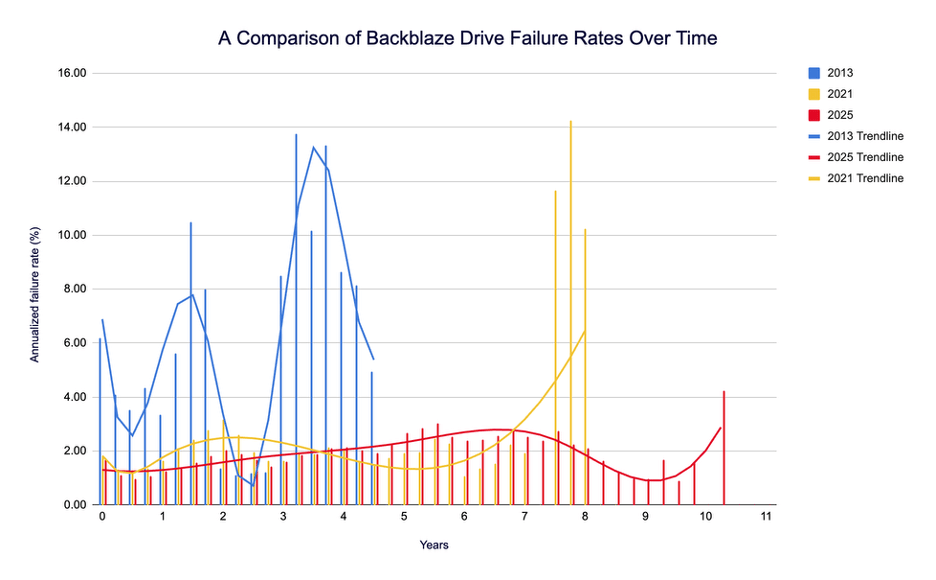
A time-aligned graph showing the 2013 and 2021 waves has also been released. While the 2013 (blue line) shows large waves and a depression that looks like it could hold water like a bathtub, the 2021 (yellow line) shows waves that are stretched out overall, and the 2025 (red line) shows smaller waves.
Regarding these changes, Backblaze points out that the previous bathtub curve was based on the assumptions that 'devices are identical and operate under the same conditions,' 'errors occur independently and are primarily due to the elapsed time of operation,' and 'the operating environment will be maintained until the end of the product's life,' and does not take into account workload, individual differences during manufacturing, firmware updates, etc. Furthermore, he explains, 'The bathtub curve is not wrong, it's just incomplete.'
Related Posts:


in Hardware, Posted by logc_nt