'Storytelling Map' is an SVG animation that lets you look back on your experiences along your travel route
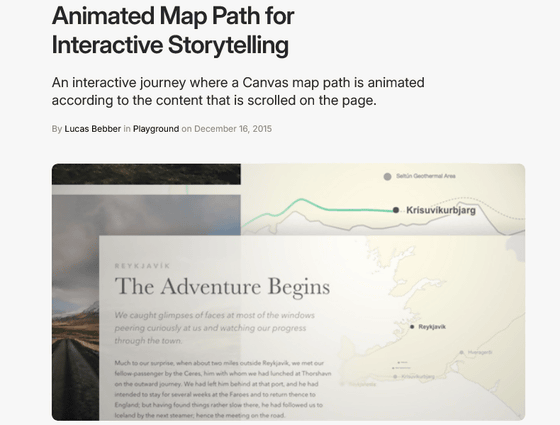
Some people who love traveling record the details of their travel experiences by taking lots of photos and posting them on their blogs, or posting their impressions of each place they visit on social media. ' Storytelling Map ,' created by software engineer Lucas Beber, is an SVG animated blog post that tracks the route taken on a trip and tells the story of the experiences at each place, allowing you to write a travelogue as if you were reliving the trip.
Interactive Storytelling | Codrops
Animated Map Path for Interactive Storytelling | Codrops
https://tympanus.net/codrops/2015/12/16/animated-map-path-for-interactive-storytelling/
Beber used photos taken by photographer Dan Rubin during his trip to Iceland to create a demo of the Storytelling Map .
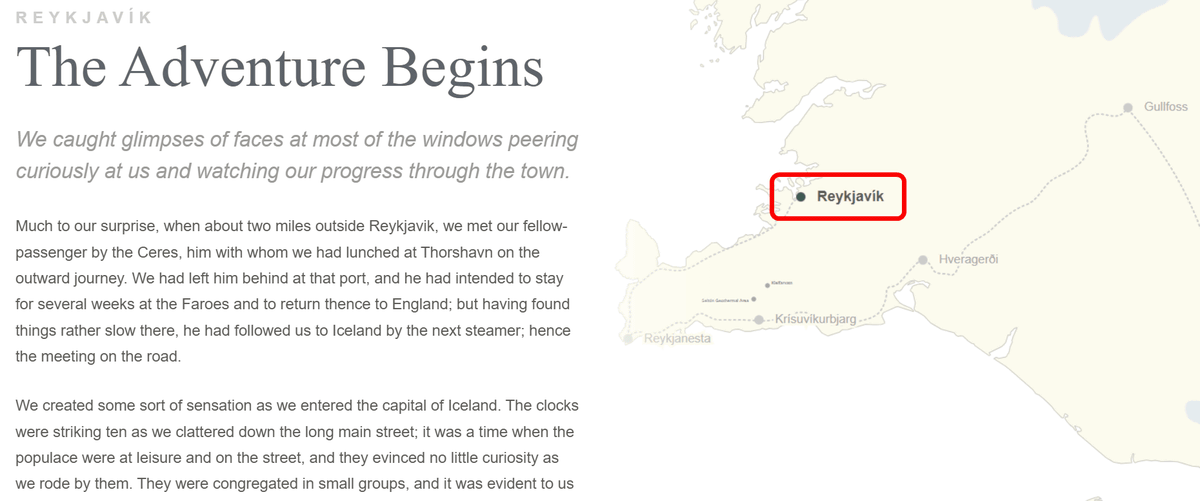
When you open the Storytelling Map, the first thing you see is a story about a trip that starts in Reykjavik, the capital of Iceland.
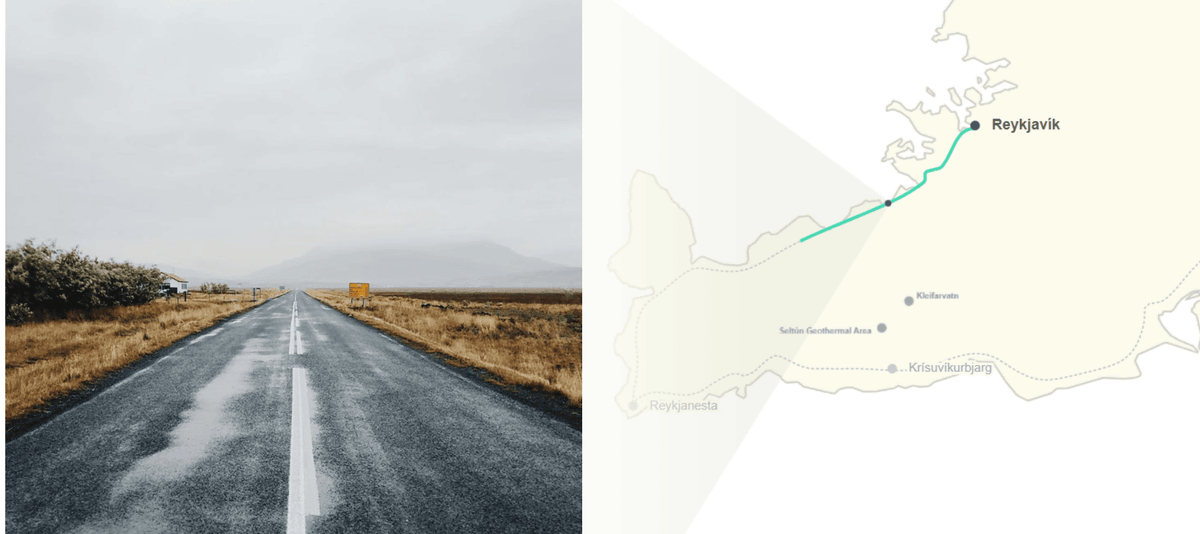
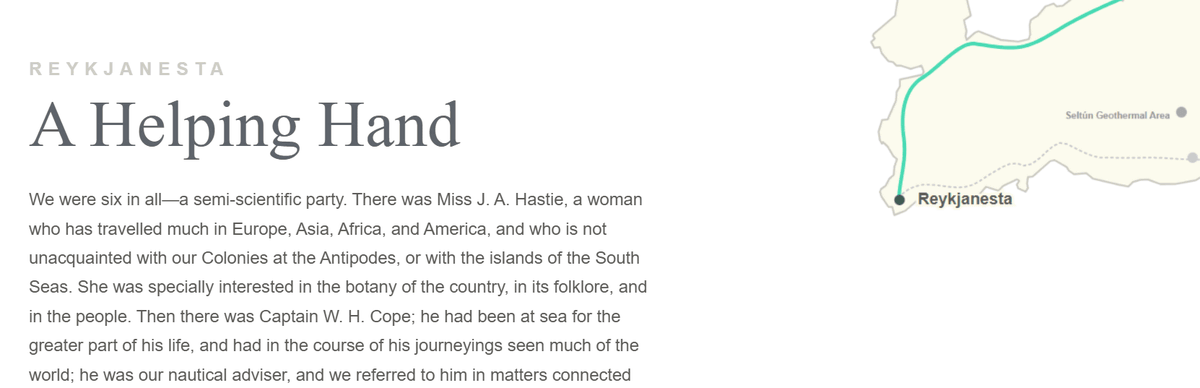
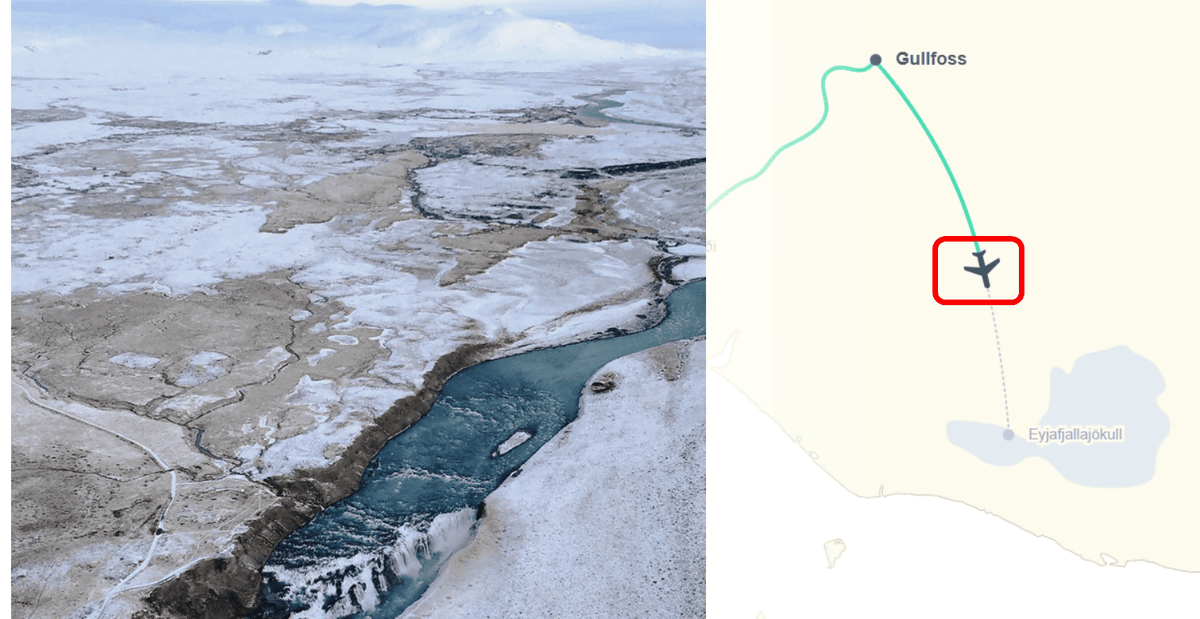
As you scroll through the page, the route Rubin took is displayed on a map, and photos taken during the trip can be seen at the corresponding points on the map where they were taken.
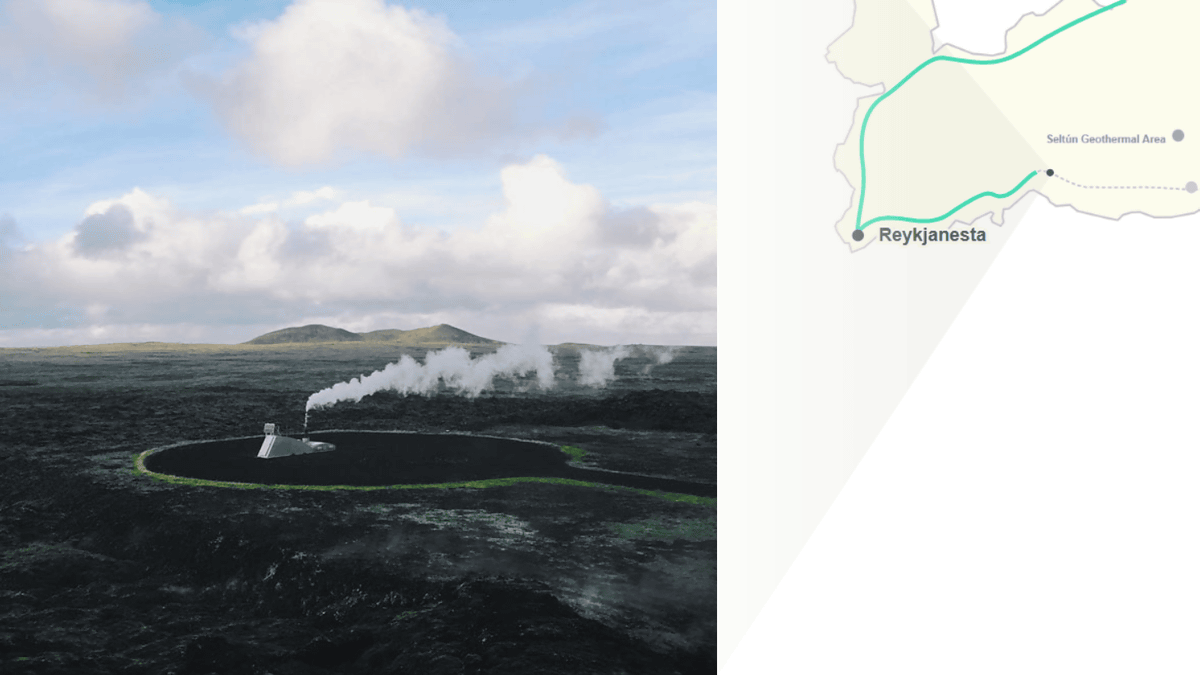
Reaching the Reykjanes Peninsula, Rubin photographed valleys and mountains, ice fields and snowy slopes, lava flows and hot springs, rivers and streams.
Routes traveled by air are shown with an airplane icon.
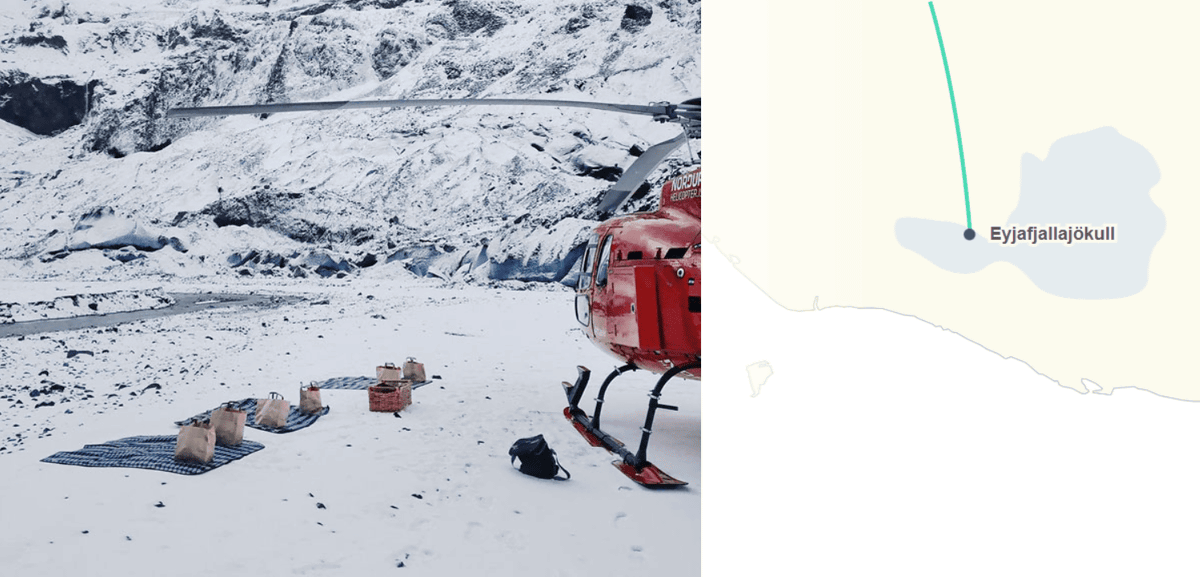
Rubin's final destination was the glacier Eyjafjallajokull in Iceland. Eyjafjallajokull is a glacier where geysers sometimes erupt, and by camping for two nights, Rubin was able to observe several small geysers of about 90 cm in size.
To create a Storytelling Map, you first need information about the route you took on your trip and where along the route the photos were taken. Then, you add any episodes you experienced at each point. When drawing a curved route on a map, you can create an animation in which the path gradually appears as you scroll by drawing it in SVG format, which is an image format. SVG has a drawing area called a 'canvas,' and by using the SVG canvas to create animations, you can manage them within HTML and easily manipulate them with CSS and JS.
The specific code for Storytelling Map is available on Beber's blog.
Animated Map Path for Interactive Storytelling | Codrops
https://tympanus.net/codrops/2015/12/16/animated-map-path-for-interactive-storytelling/
Beber published the Storytelling Map in 2015, but in February 2025, a post was made on the social site Hacker News saying , 'I'm looking for a travel blog that creates custom SVG animations to match the route you took during your travels.' In response, Beber himself said, 'I designed and programmed this. I miss doing this kind of work,' which once again became a hot topic. The Hacker News thread talks about fascinating travel blogs in various formats.
Related Posts:


in Web Service, Posted by log1e_dh